Jun 30, 2022
Whether you’re looking at monthly, quarterly, or first-half performance, this year’s S&P 500 performance has been quite weak. As investors, we must avoid falling into the sunken-cost fallacy and are forced to be forward-looking.
Starting with weak months, there have been a total of 83 months in the post-WWII era in which the S&P 500 declined at least 5%. In fact, this has occurred three times in 2022 alone, and if the current pace continues will top the post-WWII high in 2008 when there were five months of 5%+ declines. Click here to learn more about Bespoke’s premium stock market research service.

In addition to 5%+ monthly declines, we also looked at periods where the S&P 500 declined 10%+, as well as six-month periods when the S&P 500 fell 20%+ (with no prior occurrences in the last three months). Over the following day, performance was inline with the historical average following 5%+ monthly declines and 10%+ quarterly declines, but the first trading day following a six-month decline of 20%+ was much better than the historical average. Over the following week and month, though, the picture looks different as performance after 10%+ quarterly declines has been much better than average while performance following 20%+ six-month declines has been well below average. In terms of the week and month after 5%+ monthly declines, returns have pretty much been in line with the historical average.

Taking a look at positivity rates (percent of the time the S&P 500 has posted gains in a respective period), the S&P 500 has boasted above average rates following a monthly decline of 5%+ in both the next day and month, but rates are lower over the following week. After quarterly declines of 10%+, positivity rates were lower in the following day, but above average for the following week and month, coming in at 61.9% and 71.4%, respectively. On the downside, positivity rates were much lower following the first rolling six month decline of 20%+ in the next week and month, coming in at 40.0% for both. Investors should note that the first occurrence of a 20%+ rolling six month decline occurred on June 16th. Click here to learn more about Bespoke’s premium stock market research service.

Jun 30, 2022
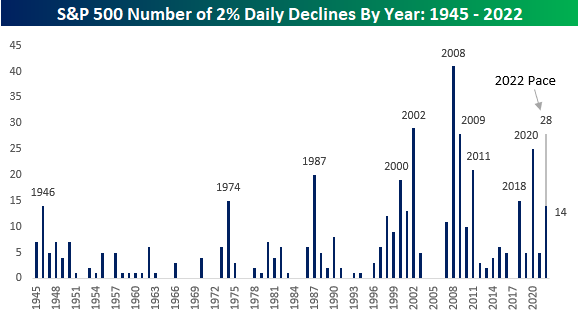
2022 has seen the bulls get slugged with a number of heavy blows. The S&P 500 has already experienced 14 separate one-day declines of 2% or more this year. That’s nine more than the entire total for 2021!
While there are still another six months left in the year, only ten other years have seen as many or more 2% daily declines in their entirety! At the current pace, 2022 would see 28 daily declines of 2%+, which would rank as tied with 2009 for the third most in the post-WWII period trailing only 2002 (29) and 2008 (41). Not great company. If 2021 was the year where nothing could go wrong for investors, 2022 has been the year where nothing is going right. Click here to learn more about Bespoke’s premium stock market research service.
Jun 14, 2022
See what’s driving market performance around the world in today’s Morning Lineup. Bespoke’s Morning Lineup is the best way to start your trading day. Read it now by starting a two-week trial to Bespoke Premium. CLICK HERE to learn more and start your trial.
“He says we’re going the wrong way.”
“Oh, he’s drunk. How would he know where we’re going.” – Planes, Trains & Automobiles

Below is a snippet of content from today’s Morning Lineup for Bespoke Premium members. Start a two-week trial to Bespoke Premium now to access the full report.
After four days of basically getting their faces beat inside out, bulls are trying to make a comeback this morning aided in part by a PPI report that wasn’t stronger than expected. Small business sentiment also managed to come in slightly better than expected, although it remains weak. One item covered in today’s Morning Lineup commentary is the fact that inflation expectations in the latest ZEW survey didn’t show a pickup in inflation expectations for the US or Eurozone.
In today’s Morning Lineup, there’s a lot covered as we discuss trading in APAC and European markets (pg 4), whether or not the Fed will go 50 or 75 bps tomorrow (pg 5), overnight economic data in Asia and Europe (pg 6), and much more.
Over the last two years or so, the market has come full circle. In February and March of 2020, there was that five-week period where the only direction the market would move was lower. Shortly after, the Federal Government and Federal Reserve unleashed massive amounts of stimulus, and the market started to turn around. By early 2021, the market had completed a complete 180, and the only direction it could move was higher. Then, late last year as government stimulus started to dry up and the Federal Reserve started to get religion on inflation, cracks in the market started to emerge. By early this year, we were calling it a one-step forward and two-step backward market where every positive day was offset by at least two bad days taking the market to progressively lower levels in the process.
As painful as the one-step forward and two-step backward market felt, at least there were some positive days. Over the last few days, it has become a one-directional market, and the direction has been extreme in the wrong way. Over the last four trading days, the net advance/decline (A/D) reading for the S&P 500 has been negative 400 or lower meaning that in each of the last four trading days there have been 400 more stocks that traded lower on the day than higher. To give you some perspective on how extreme this type of streak is, since 1990, there have been ten years where for the entire 12 months there weren’t even four days where the net A/D reading for the S&P 500 was at negative 400 or lower. As shown in the chart below, there has never been a streak of similar duration, and the only time there were even three consecutive days of -400 readings was in August 2015 at the height of concerns over the Chinese yuan devaluation.

Start a two-week trial to Bespoke Premium to read today’s full Morning Lineup.
May 24, 2022
It seems like a distant memory now, but Monday’s rally marked just the 13th time all year (and over the last 100 trading days) that the S&P 500 tracking ETF (SPY) opened higher and traded in positive territory all day (‘100% positive day’). The chart below shows the rolling 100-trading day total number of 100% positive days for SPY since 1994, shortly after the ETF launched. The current level of 13 is already well below the long-term average of 18, but last week, the reading was even lower at 12. The last time the 100-day rolling total was lower than that was in May 2009, and the lowest readings ever recorded were in periods beginning in October 2002 and September 2008 with just six in a 100-trading day span.
What makes the current period unique is how quickly the rate of 100% positive days has plummeted. 100 trading days ago, the rolling total was more than twice the current level at 29. Also, it was only in February 2021 (less than sixteen months ago) that the number of 100% positive days reached a record high of 33 on 2/4/21. That peak came just weeks before the Federal Government sent out the third and final round of stimulus checks. Just as massive amounts of fiscal and monetary stimulus helped to support markets during COVID, the withdrawal of these supports has introduced gravity back into the equation. Click here to learn more about Bespoke’s premium stock market research service.

May 24, 2022
There’s no questioning that the equity market has been extremely volatile this year. So far in 2022, the S&P 500 has averaged an absolute daily move of 121 basis points (bps). Although the broader index has been incredibly weak over the last 100 trading days (down 17.1%), performance among individual sectors has diverged widely, as Energy has gained 50.7% while the Communication Services sector has declined 32.0%. The 82.7 percentage point performance spread between the two sectors is one of the highest on record. Only July of 2009 and March of 2000 saw higher readings.

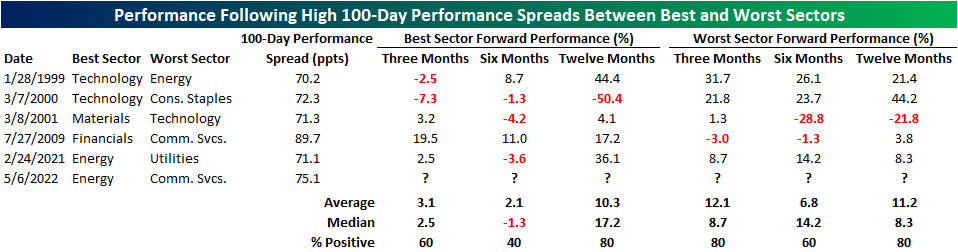
Since 1990, there have only been six times in which the best-worst 100-day performance spread crossed above 70 ppts for the first time in at least 50 trading days. This tends to occur amidst a volatile market environment. In the late 90’s, investors flooded into technology stocks while dumping ‘traditional’ stocks, which led to the Technology sector outperforming Energy by 70.2 percentage points in a 100-trading day span ending on 1/28/1999. When the dot-com bubble began to burst, the inverse occurred, and Materials outperformed Technology by 71.3% in the 100 trading days ending 3/9/2001. Coming out of the Global Financial Crisis, the Financials sector roared off of a depressed base, leading to outperformance against the Communication Services sector of 89.7 ppts. In late February of 2021, the Energy sector began to bounce back after the demand shock in the industry began to abate, while the Utilities sector remained relatively weak, leading to a 100-day performance spread of 71.1 ppts. This year, the sky-rocketing price of oil has propelled energy stocks higher while the Communication Services sector has been hampered by concerns that a peak demand environment was reached in 2020 and 2021 while valuation multiples have simultaneously contracted (largely due to the Fed’s hawkish pivot) pushing the 100-trading day performance spread out to 82.7 ppts.

As investors, we must remain forward-looking. So, what typically happens after dramatic performance spreads are reached between the best and worst sectors? It’s a small sample size, but based on the previous five occurrences, investors should consider rotating out of the best performing sector (which in this case would be Energy) after the spread hits 70 percentage points and move into the worst performing sector (Communication Services).
Three months after these occurrences, the worst-performing sector over the prior 100 trading days has booked a median gain of 12.1%, which is nine ppts better than that of the best performing sector. Six months later, the median performance of the worst-performing sector in the initial 100 trading days outperformed the best performing sector by 15.5 ppts. Interestingly, twelve months later, the best performing sector in the initial 100 trading days regained the lead over the worst-performing sector outperforming on a median basis by a margin of 17.2% to 8.3%. In terms of consistency, three and six months later, the previously worst performing sector outperformed the best performing sector three out of five times, but a year later, the previously best performing sector outperformed the worst-performing sector four out of five times. Click here to become a Bespoke premium member today!