Apr 18, 2022
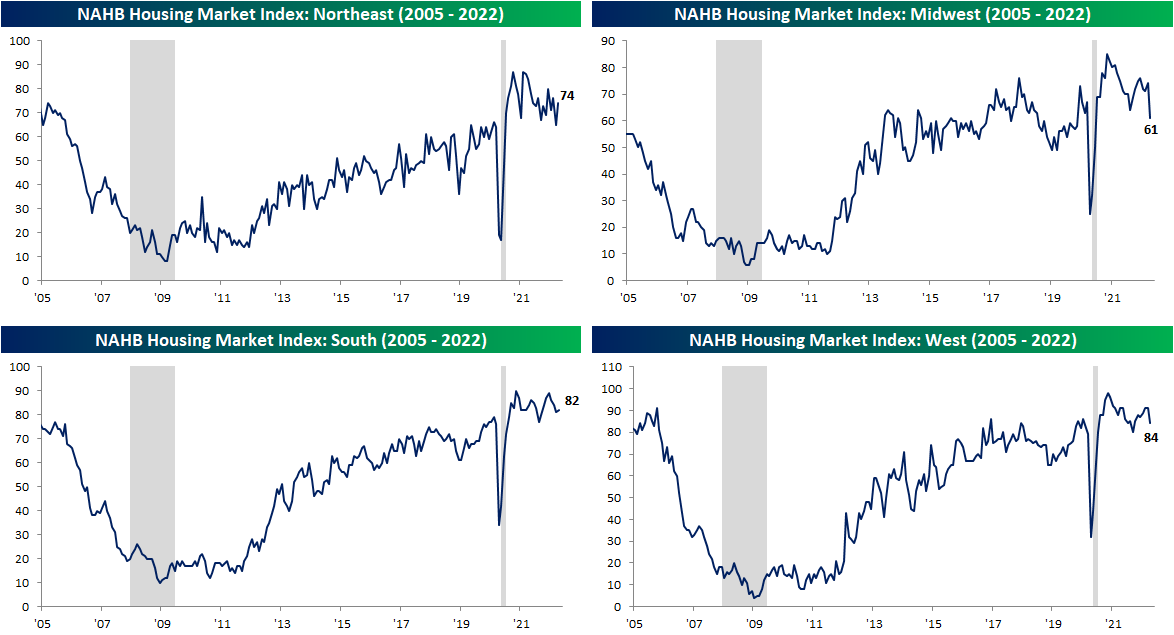
As the national average for a 30-year fixed rate mortgage has risen to and remained above 5%, homebuilder sentiment has been reversing its pandemic gains. The NAHB’s monthly homebuilder sentiment index dropped 2 points in April to 77. That was the fourth decline in a row bringing the headline number to the weakest reading since September of last year. That is also now only one point above the December 2019 pre-pandemic high.

The decline this month was mostly driven by a decrease in traffic. That index dropped 6 points to 66 which is the weakest level and the biggest one-month decline since last August. Meanwhile, present sales dropped 2 points for the second month in a row. On the bright side, future sales actually ticked up 3 points to snap a three-month losing streak. That being said, the current level of this index is much less elevated within its historical range compared to the others.

Geographically, there are some large divergences in homebuilder sentiment. For starters, the Northeast showed the most impressive improvement with the index rising 9 points month over month. Whereas last month it was the lowest within its respective historical range, today it is the most elevated. The South also saw an improvement as this region has perhaps been the most stable across the pandemic years. The West and Midwest were other stories entirely in April. The Midwest experienced its second-largest decline on record behind the 42 point drop in April 2020 and is now at the lowest level since June 2020. Meanwhile, the West fell 7 points. That also was the biggest drop in two years though the index saw an even lower reading as recently as last September.
As homebuilder sentiment drops, so too have homebuilder stocks. The iShares US Home Construction ETF (ITB) — which tracks the space — has been falling sharply since peaking around the turn of the year. Click here to view Bespoke’s premium membership options.

Apr 14, 2022
Heading into this week, bullish sentiment on the part of individual investors, measured by the weekly AAII survey, was already depressed with less than a quarter of respondents reporting optimistic sentiment. One week later with the S&P 500 continuing to move lower and a couple of hot, but not exactly unexpected, inflation readings in the interim, bullish sentiment has collapsed another 8.9 percentage points to the lowest level since the week of September 3rd, 1992. That’s right, bullish investor sentiment never got this low even at the depths of the pandemic, during the Global Financial Crisis, or during the Dot Com bubble burst. This week marks one of only 35 weeks since the survey began in 1987 that bullish sentiment was below 20%; the most recent being only back in February when it fell to 19.2%.
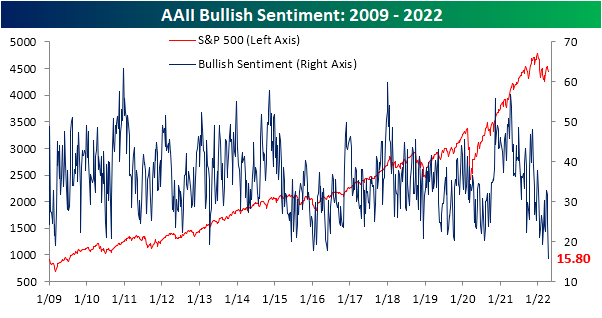
As could be expected, the huge drop and the historic low in bullish sentiment was met with a coincident increase in bearish sentiment. Bearish sentiment rose 7 percentage points to 48.4%. While that is an elevated reading, there have been a couple of even more elevated readings as recently as March 17 (49.8%), February 24 (53.7%), and January 27 (52.9%).

Even though bearish sentiment is not at a new high, the still-elevated reading on pessimism paired with the extremely depressed reading on bullishness has resulted in the bull-bear spread to fall much deeper into negative territory. Only two weeks ago, bulls actually outnumbered bears. Today, bears outnumber bulls by 32.6 percentage points. The 37 point drop since that positive reading marks the largest two-week decline in the bull-bear spread since April 2013. It is also the lowest level of the spread since that same period.

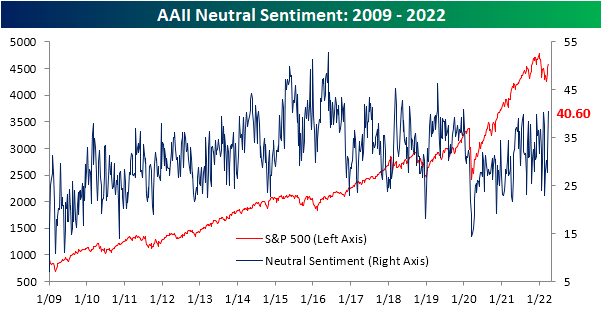
While bearish sentiment picked up, not all of those gains came from the decline in bulls. Neutral sentiment was slightly higher rising 1.8 percentage points to 35.7%. That is a few percentage points above the historical average, but it is also well below the multiple highs of the past year. You can read Bespoke’s full analysis of investor sentiment and its contrarian aspects with a two-week trial to Bespoke Premium.

Apr 12, 2022
Sentiment on the part of small businesses deteriorated further in the month of March as the NFIB’s Small Business Optimism Index dropped 2.5 points to 93.2. That took out the January 2021 level for the weakest print for the index since the start of the pandemic in the spring of 2020.

Considering the headline index is only a couple of points above the pandemic low, last month’s reading is only in the 16th percentile of all months on record going back to the start of the report in 1986. The month-over-month decline was also historically large ranking in the bottom decile of all monthly changes. The same could be said for multiple other categories. For example, expectations for the economy to improve and expectations for higher real sales came in at or close to record lows as the month-over-month declines were in the bottom 2% of all monthly moves. This downbeat sentiment was a complete disconnect from the levels of actual sales changes (more on this below). On the other hand, there is a wide variation across categories with top decile readings for several indices like plans to increase employment, current inventories, job openings hard to fill, and compensation-related indices.

Many of the strongest readings of the report are related to employment. Plans to increase employment have pulled back significantly from pandemic highs and are back within the range of readings from the few years prior to the pandemic. Regardless, March’s reading was in the top decile of historical readings. Actual reported changes to employment, however, have continued to fluctuate around zero and were negative in March meaning small businesses saw a decrease in hiring. That lack of hiring comes as businesses continue to report historic difficulty in filling open roles. This reading too has been rolling over though. That is echoed by fewer businesses reporting the cost or quality of labor as their single biggest concern. That combined reading has fallen from a high of 40% in September of last year to only 30% today. As other issues (namely inflation) have taken precedent as the main concern of small business owners, cost of labor remains elevated with near-record but peaked readings in compensation and compensation plans.

As employment metrics remain elevated but show signs of rolling over, readings on expectations for general conditions and sales remain weaker. Outlook for general business conditions stands out as the weakest reading of the report as the index dropped another 14 points in March to set the bar even lower for a record low. Given the pessimism surrounding business conditions, the share of businesses reporting now as a good time to expand fell for the third month in a row to match the February 2021 low. One likely reason for the aforementioned pessimism is soaring prices shown through yet another record high set by the higher prices index.
Not only has the outlook for general business conditions soured, but so too have sales expectations. Small businesses reported the worst expectations for sales since the spring of 2020. The only other period in the history of the data going back to 1986 with as weak of an optimism reading for sales was during the Great Recession. That stands in stark contrast with the actual reported sales changes. Small businesses actually reported positive momentum for sales, though, higher costs are likely eating into profitability as actual earnings changes went unchanged at deeply negative levels. In the release, the NFIB highlighted that of those respondents who reported lower profits, 35% blamed higher material costs and 13% reported higher labor costs. Another 23% blamed weaker sales. Click here to view Bespoke’s premium membership options.

Apr 11, 2022
Earnings season kicks off this week as the major banks and brokers start to report their first-quarter numbers. BlackRock (BLK) and JP Morgan Chase (JPM) will kick things off on Wednesday, followed by Citigroup (C), Goldman Sachs (GS), and Morgan Stanley (MS) leading the charge on Thursday. On Friday, the equity market is closed in observance of Good Friday, but Bank of America (BAC), Bank of New York (BK), and Charles Schwab will all report next Monday (4/18). While it will be a busy few days for Financials, the heart of earnings season doesn’t really get rolling until later this month. The five largest companies in the S&P 500 (AAPL, AMZN, FB, GOOGL, and MSFT) won’t report until the last week of April.
For a more detailed rundown of the earnings schedule for the upcoming season, please see our Earnings Explorer Tool (available to all Institutional clients) on the Tools section of our website, and to see our quarterly preview of the upcoming earnings season with respect to analyst sentiment heading into it, start a two-week free trial to either Bespoke Premium or Bespoke Institutional.

Mar 31, 2022
The last couple weeks of the first quarter have seen equities reverse a sizable portion of this year’s losses and sentiment has rebounded in sync, though, bullish sentiment turned slightly lower this week in spite of the S&P 500’s move higher. From the weekly AAII sentiment survey, bullish sentiment shed 0.9 percentage points coming in at 31.9%. Even after that decline, the current level of reported optimism remains above all others (outside of last week) since early January, but bullish sentiment still would need to rise another 6 percentage points to move back up to its historical average.

While more investors are not reporting much optimism, fewer are outright bearish. Bearish sentiment fell for a second week in a row falling another 7.9 percentage points to 27.5%. With a little over a quarter of respondents reporting as bearish, this sentiment reading is at the lowest level since November. That is also now the biggest two-week decline in bearish sentiment (22.3 percentage points) since November 2009 when it had fallen 23.74 percentage points in a two-week span.

Finally, we would note that given bearish sentiment has plummeted at a historic rate without much of an increase in bullish sentiment, neutral sentiment has picked up the difference. That reading clipped above 40% this week for the highest level since January 2020.
Other sentiment surveys like the Investors Intelligence one and NAAIM’s Exposure Index have also pivoted more bullish this week. As a result, our sentiment composite is close to zero meaning across these three indicators, sentiment is now only just slightly below the historical average. Click here to view Bespoke’s premium membership options.
