Jul 20, 2022
Since June 16th, the market has reversed course higher, making the date at least a near-term bottom. From a technical perspective, the Russell 1000 broke through its 50-day moving average yesterday and broke above its upper downtrend line today. The 50-DMA is still moving lower, but this is the first time that the Russell 1000 has been above the 50-DMA since April 20th. However, the index is still 9.7% below its 200-DMA. These moves come as commodity prices have pulled back and earnings season begins.

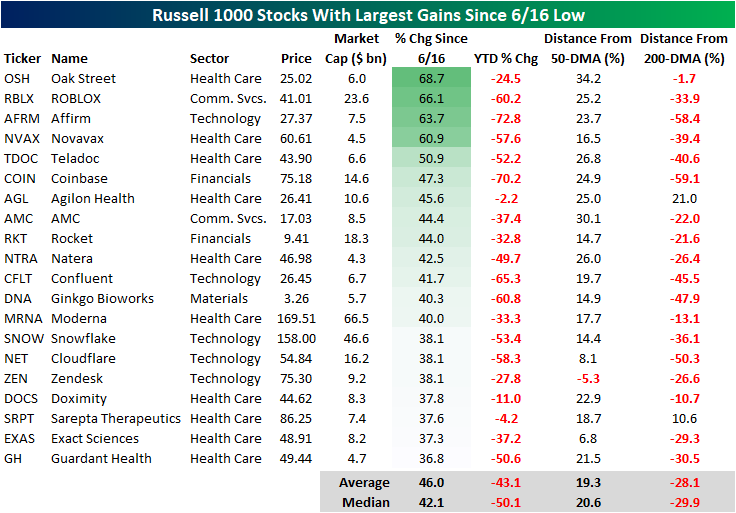
As we highlighted in a Chart of the Day earlier this week, the lagging sectors during bear market declines tend to be the leaders in bear market rallies, which is holding true in the bounce since 6/16. The table below shows the 20 best performing stocks in the Russell 1000 Index since the 6/16 low. As you can see, these stocks are all still down considerably on a YTD basis, declining a median of 50.1%. However, these stocks have rebounded by a median of 42.1% since the low on 6/16. Only one of these stocks is below its 50-DMA, and only two are above their respective 200-DMA. If you think that the bear market has concluded, these would be some of the names worth looking deeper into.
On the other hand, the best performing sectors during bear market declines tend to be the worst performing sectors during bear market rallies. Of the 20 worst performing Russell 1000 stocks since 6/16, 14 belong to the energy sector (which has been the best sector on a YTD basis by a wide margin). On a median basis, these 20 stocks are still up 13.6% on a YTD basis, but they’ve shed 13.7% of their value since the market bottomed in mid June. Notably, these stocks (on a median basis) are closer to their 200-DMAs than they are to their 50-DMAs. If you think that we are currently in a bear market rally that is bound to reverse course, these names would be worth looking deeper into.

Jun 29, 2022
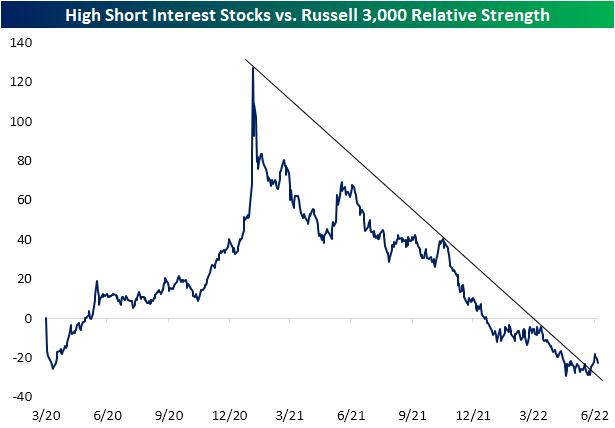
As we highlighted in a post yesterday, the relative strength of the 100 stocks with the highest levels of short interest against the Russell 3000 has broken its downtrend. This downtrend had been in place since the end of the meme stock mania in January of 2021. Just to refresh your memory, that chart is provided below.
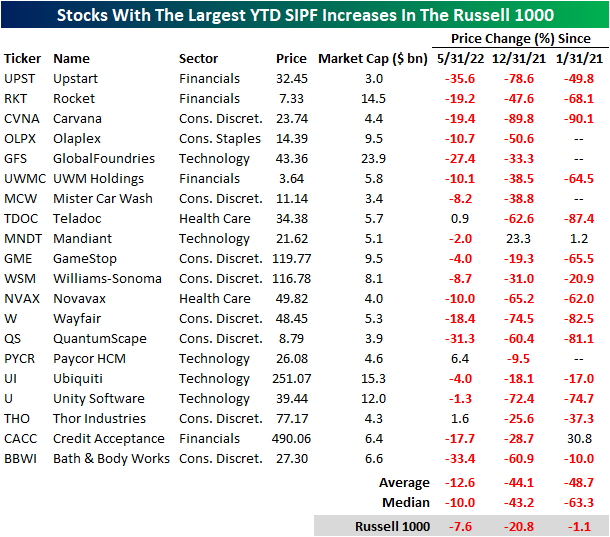
Today, we took a look at the 20 Russell 1000 stocks that have seen the largest increases in short interest as a percentage of float (SIPF) on a year to date basis. Leading this group is Upstart (UPST), the buy now pay later firm that has been decimated as growth stocks have gotten crushed and consumer confidence weakens to historic levels. UPST saw SIPF rise by 27.1 percentage points on a YTD basis and by an additional 2.0 percentage points in June. Notably, UPST appeared on our Top 20 P/S Decliners list as well, which we published yesterday. Unity Software (U) is the only other name to appear on both lists. The largest names on this list by market cap are GlobalFoundries (GFS), Ubiquiti (UI) and Rocket (RKT).

The performance of these twenty names has been quite weak on a month over month and YTD basis. Additionally, these names have massively underperformed the broader index since the end of the meme stock mania, trading down by 48.7% on average (median: -63.3%) compared to the Russell 1000’s loss of just 1.1%. On a YTD basis, these stocks have shed 44.1% of their value on average, which was accelerated by a 12.6% average loss since the end of May. Although it’s difficult to find any positivity in these names, they are primed for short squeezes or reversals as shorts cover their positions (which forces buying. Click here to learn more about Bespoke’s premium stock market research service.
Jun 28, 2022
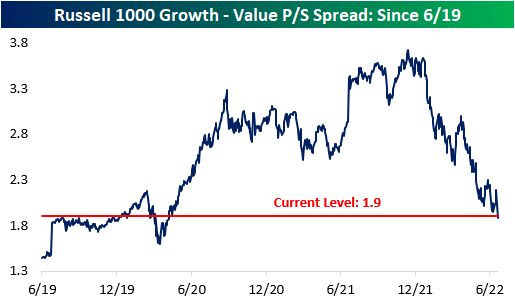
It’s no secret that there has been a massive pullback in valuation multiples, and stocks that had higher multiples have been hit much harder by the recent market pullback. This comes as rate hikes increase the discount rate and the era of “free money” comes to an end, which inherently lowers the risk appetite of investors. The chart below shows the price to sales (P/S) spread between the Russell 1000 growth index and the Russell 1000 value index. Naturally, growth stocks should always trade at higher multiples, but the spread became magnified throughout the pandemic. The spread peaked in mid-November 2021 at 3.7, but it has contracted by 1.8 points to 1.9 as of today’s open. Whereas the growth index has seen its P/S ratio decline by 36.4%, the value index has only seen a P/S decline of 13.0%. The growth index currently has a P/S ratio of 3.6, compared to 1.7 for the value index. The P/S spread between the two indices is now inline with pre-COVID levels, so the stretched growth multiples of the pandemic-era have come full circle. Click here to learn more about Bespoke’s premium stock market research service.
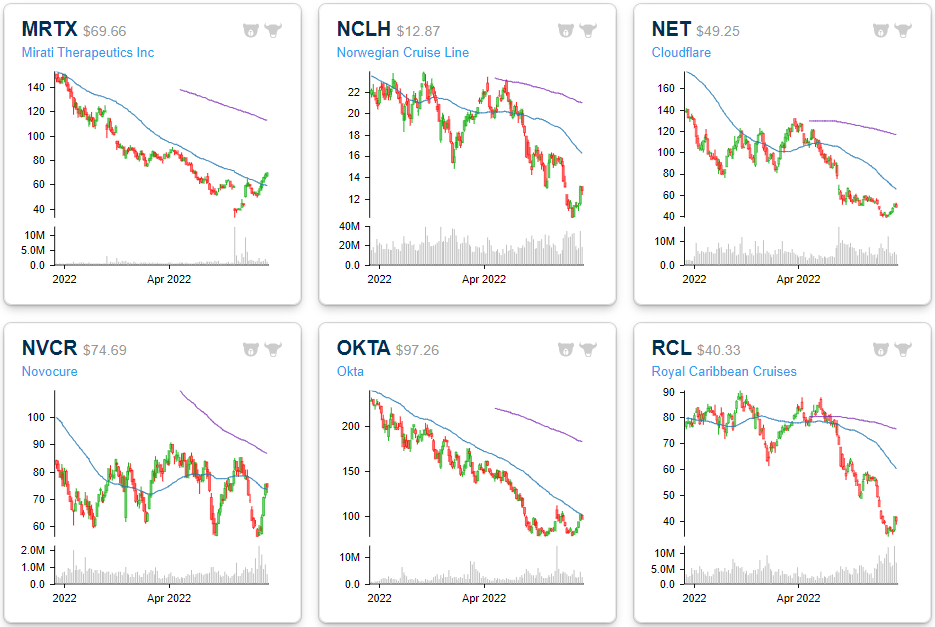
Dissecting this further, we took a look at the 20 Russell 1000 stocks that have seen their P/S multiples compress the most since their respective 52-week highs. Leading this group is Lucid (LCID), which has seen the P/S ratio decline by a whopping 275,309 points. This comes as sales increased substantially and the price declined significantly (-68.2% since the 52-week high). Even still, LCID’s P/S ratio remains in the stratosphere at 359. Next on this list is Norwegian Cruise (NCLH) and Carnival (CCL), which have experienced a similar phenomenon. Sales fell off a cliff for the cruise lines following COVID, causing their P/S ratios to spike. As sales have returned on the re-opening and share prices have continued to decline, P/S ratios have fallen significantly. The largest decliners in share price since their respective 52-week highs on this list are Upstart (UPST), DocuSign (DOCU) and Unity Software (U), which have declined by 90.4%, 79.0% and 78.9%, respectively. Upstart has seen its P/S ratio fall from 37.8 down to 3.0. The median stock on this list trades 10.8 times LTM sales, which is still aggressive to say the least. Most stocks topped out either last summer or in October/November.

The six month price charts below are available using our Chart Scanner tool. You can click here to view a custom portfolio of these twenty stocks if you’re already a subscriber. As you can see, the vast majority are in sustained downtrends. However, if interest rate pressures subside and risk appetites increase, these twenty names could benefit through multiple expansion. Click here to learn more about Bespoke’s premium stock market research service.


May 17, 2022
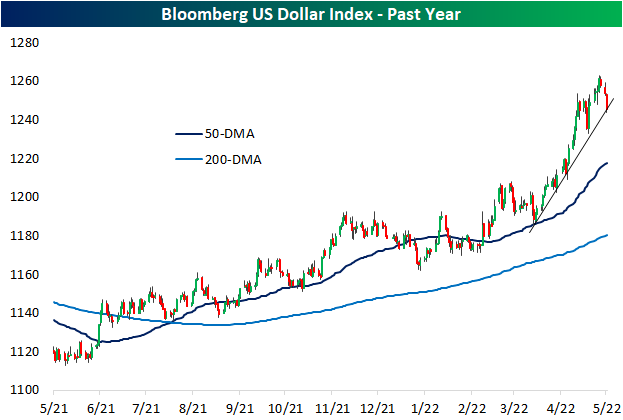
The US dollar has surged amidst the weakness in risk assets in 2022. While also part of a longer-term and more gradual uptrend over the past year, in the past couple of months the Bloomberg Dollar Index has seen its uptrend steepen significantly. Since the last retest of its 50-DMA at the end of March, the dollar was up over 6% through the closing high last Thursday. To round out last week and start this week, the dollar has pulled back sharply with a 1.25% decline. While that may not sound like much, it ranks in the third percentile of all 3-day moves going back to the start of the index in 2005.
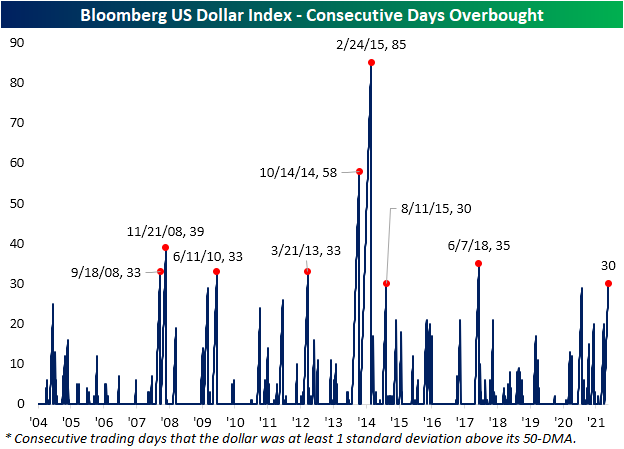
At the moment, the dollar is testing the aforementioned steep uptrend off the late March low. Assuming that the uptrend or any recent lows do not provide support, the dollar has much further to go until it would test its 50-DMA. In fact, the dollar would currently need to fall another 2.28% to reach its 50-DMA as it has consistently traded well above that moving average for multiple weeks in a row. As shown in the second chart below, the dollar recently hit some of the most overbought levels of the past five years, and the long stretch of days with overbought (1+ standard deviation above its 50-DMA) readings has continued.

While recent declines have put the streak on the ropes, today marks the 30th consecutive trading day that the dollar has been at least one standard deviation above its 50-DMA. Going back through the history of the index, there have only been 8 other streaks that have also gone on for at least 30 trading days. The most extended of these ended in February 2015 at 85 days long. The next longest only occurred shortly before that in October 2014.
Additionally, given the dollar has been pulling back, it could be reasoned that stocks with heavy domestic exposure would underperform relative to those with more international exposure. Since last Thursday, that has largely been the case. In the chart below, we have broken down the Russell 1,000 into deciles based on their share of revenues generated from abroad. The first decile is composed entirely of stocks with 100% of revenues generated within the US while the tenth decile is the stocks with the most international exposure. That tenth decile has seen notable outperformance with an average gain of nearly 6% versus an average of 4.2% for all other deciles. The eighth and ninth deciles have also averaged stronger returns than most other groups while the worst performance comes from the first decile, the 100% domestic stocks. Click here to learn more about Bespoke’s premium stock market research service.
