Relative Strength in Dividend Stocks
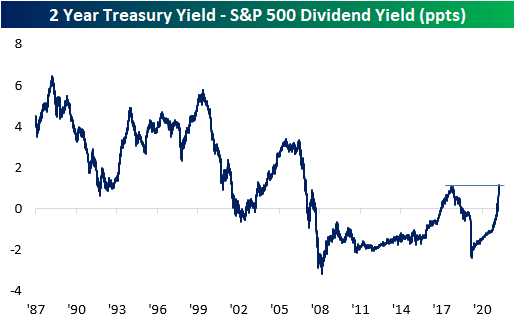
In 2020 and most of 2021, dividend stocks underperformed the broader S&P 500 as investors put an emphasis on growth due largely to the low-rate environment. Since the Fed pivot to a tightening bias beginning in late 2021, though, there has been a sharp reversal in this trend.
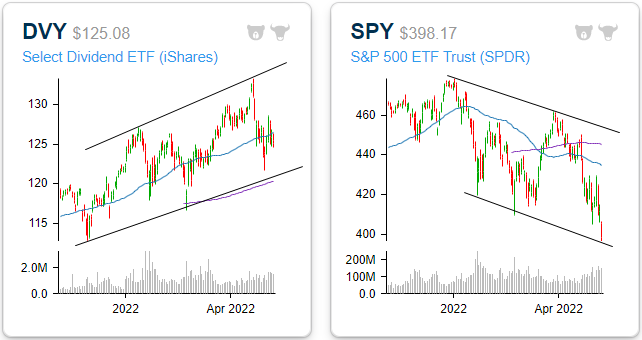
As it currently stands, the iShares Select Dividend ETF (DVY) has made up just about all of its pandemic-era underperformance versus the S&P 500 (SPY). Since the pre-pandemic highs, DVY has gained 16.9% versus a 17.9% advance for SPY, and that doesn’t even include the impact of dividends. After taking into account DVY’s higher yield (3.0 vs 1.6%), it is actually outperforming SPY during this span. Looking more closely at just 2021, DVY has outperformed SPY by 17.7 percentage points (+1.3% vs -16.3%) as investors have exited growth and into more value and income-oriented investments.

Whereas all of the major indices have entered downtrends, DVY is yet to break its uptrend. The ETF is trading well above its 200-DMA but slightly below the 50-DMA. Overall, the technical picture is relatively attractive, especially in comparison to the broader market. The following graphs are accessible through our Chart Scanner tool. Gain access to our proprietary tools by clicking here to view Bespoke’s premium membership options.
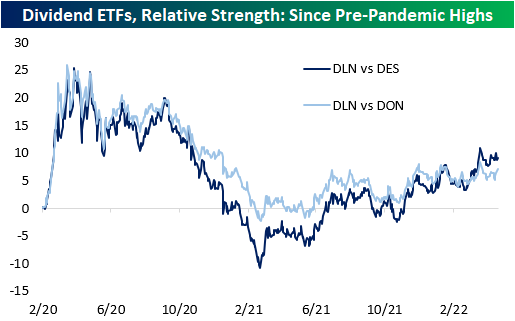
Within the high-dividend space, large caps have outperformed both mid and small caps. The WisdomTree US Large Cap Dividend ETF (DLN), the WisdomTree US Mid Cap Dividend ETF (DON), and the WisdomTree US Small Cap Dividend ETF (DES) were the funds used to compare performance across market caps. As you can see from the chart below, the larger companies that pay hefty dividends have outperformed mid-caps, and mid-caps have outperformed small caps. All three ETFs have similar yields, so the market cap discrepancies are likely more market-related.
While the average S&P 500 stock is down 11.8% on a year-to-date total return basis (median: -14.7%), the 25 highest dividend-paying stocks excluding energy (shown below) are down an average of 8.6% (median: -11.8%). Although this performance is not stellar, the average is still 320 basis points above that of the broader index. Given the recent surge in energy prices over the last year, a number of stocks in the Energy sector have seen their dividend payouts surge. Given the volatile nature of energy prices, the level of these yields may not be sustainable, so for that reason, we have left them out of this specific list.