Chart of the Day: How Current Valuations Stack up to Recent History
Four Cities See Home Prices Decline in Most Recent Case Shiller Release
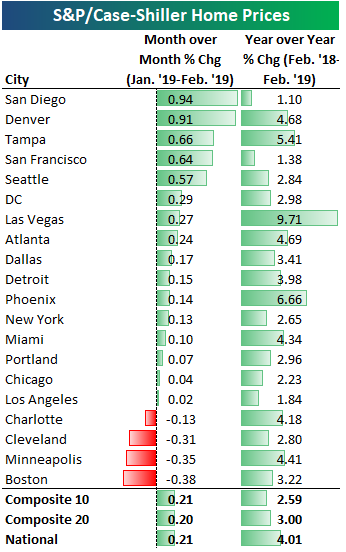
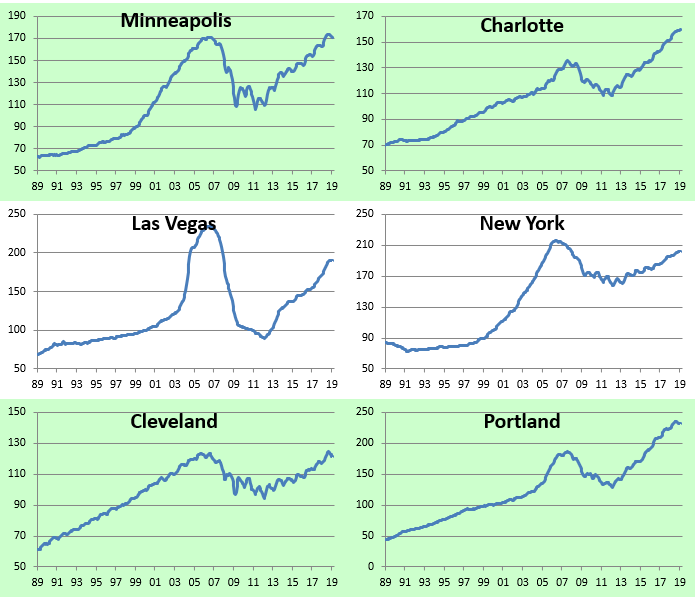
The newest S&P/Case Shiller home prices indices were released last week, and below is an updated look at the data. On a month-over-month basis, 16 of 20 cities saw home prices gain, with Charlotte, Cleveland, Minneapolis, and Boston seeing declines ranging from -0.13% to -0.38%. On a year-over-year basis, all 20 cities saw gains ranging from as low as +1.1% for San Diego to as high as +9.71% for Las Vegas.
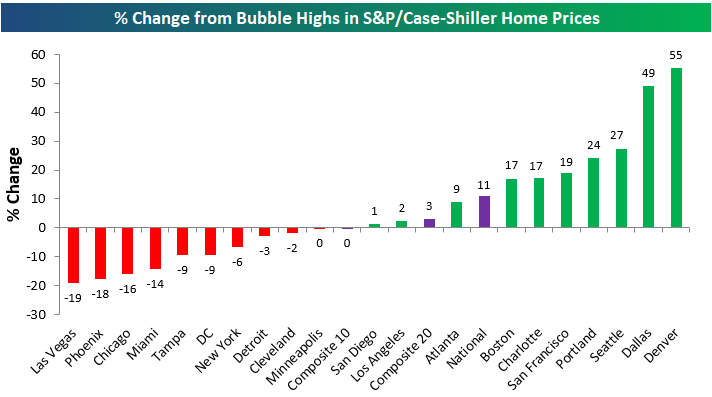
Below we show where home prices are now compared to where they were at their peaks during the mid-2000s housing bubble. The composite 10 and 20 city indices are basically at the flat line, meaning they’ve gained back all of their post-bubble losses but haven’t moved too far above them at this point. Denver prices are up the most at 55% above their prior highs, followed by Dallas at +49%, Seattle at +27%, and Portland at +24%.
Ten cities are still below their highs from the prior bubble, with Las Vegas the furthest below at -19%.
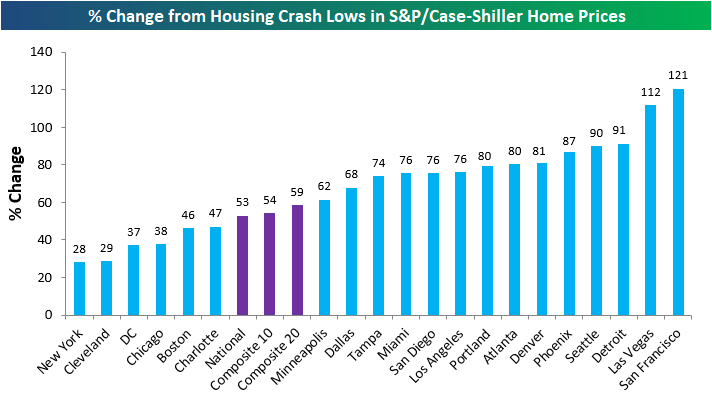
Below we show how much each city has gained from their respective lows made during the housing crash that followed the bubble. The composite indices are up more than 50% off of their lows, while San Francisco and Las Vegas are up more than 100%. New York ranks at the very bottom of this list with a bounce of just 28% off of its low at this point.
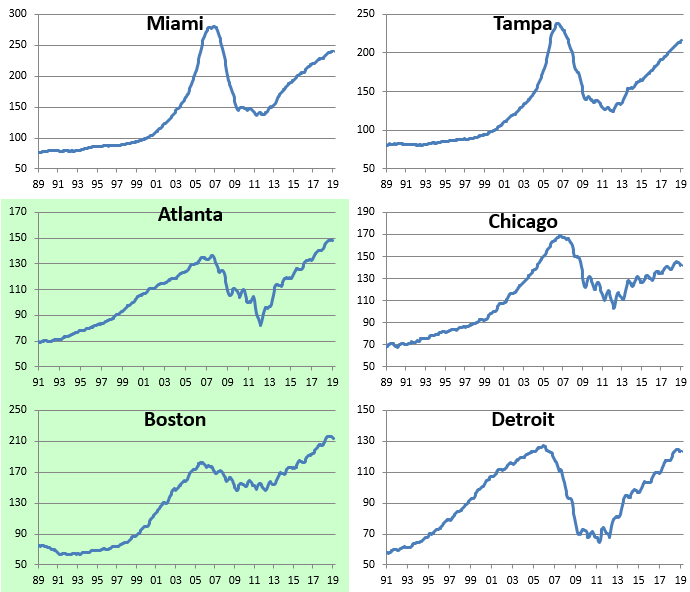
Below we show historical home price charts for each city tracked. Cities shaded in green are ones that have eclipsed their prior housing bubble highs. Get Bespoke’s most actionable research with a two-week free trial to any of our three membership levels.


Bespoke Stock Scores — 5/7/19
Morning Lineup – Trade Not the Only Headline Weighing on Stocks
It’s not just US-China trade headlines weighing on global equities this morning. Equities in Europe are trading lower after Factory Orders in Germany showed a much lower than expected increase in March (0.6% vs 1.4%). Along with that weak report, the European Commission just released economic forecasts and lowered 2019 GDP growth forecasts for the region from 1.3% down to 1.2% and said risks from global trade tensions and Brexit remain ‘pronounced’. Not to be left out of the discussion, the Federal Reserve issued its May 2019 Financial Stability Report which included the warning that “elevated valuation pressures are signaled by asset prices that are high relative to economic fundamentals or historical norms.”
Even the flow of earnings reports hasn’t been anything special in the last 15 hours. Since the close on Monday, 155 companies have reported earnings and of those, only 61% have exceeded EPS forecasts, while a slightly lower percentage (59%) managed to exceed topline revenue estimates.
We’ve just published today’s Morning Lineup featuring all the news and market indicators you need to know ahead of the trading day. To view the full Morning Lineup, start a two-week free trial to Bespoke Premium.

Along with the general rebound in equities across the board, small caps managed to finish the day slightly in the green yesterday as the Russell 2000 closed at its highest level since 10/9/18. Yesterday’s strength served as a follow-through to Friday’s breakout above resistance where the Russell finally managed to break above a level that has repeatedly acted as resistance over the last six months.

In addition to positive price action in small caps, breadth has been holding up well too. While not yet at a new high, last Friday, the Russell 2000’s cumulative A/D line reached its highest level since September 21st. Unlike the S&P 500, though, the peak breadth reading for the Russell was at the end of last August. Still, as evidenced by the recently widening gap between the two lines below, breadth has been increasingly outpacing price in the Russell 2000 for the last two months.

Start a two-week free trial to Bespoke Premium to see today’s full Morning Lineup report. You’ll receive it in your inbox each morning an hour before the open to get your trading day started.
The Closer — Gap Down & Run Higher, Small Caps, Sentix, Prime Age Potential — 5/6/19
Log-in here if you’re a member with access to the Closer.
Looking for deeper insight on markets? In tonight’s Closer sent to Bespoke Institutional clients, as the S&P 500, along with other major indices, saw a significant gap down today of over 1%, regaining much of those losses in today’s trading, we review what these types of gap downs typically mean going forward. We then turn our focus to small caps, showing which sectors have been outperforming large caps. Moving on to macro data, we review the growing optimism as seen in Sentix global sentiment surveys. We finish with a dive into prime-age labor data.

See today’s post-market Closer and everything else Bespoke publishes by starting a 14-day free trial to Bespoke Institutional today!
April 2019 Headlines
Earnings To Watch
Earnings season may be starting to wind down, but it is still going to be a busy week of quarterly reports. Using our Earnings Explorer, we can see some of the more interesting companies scheduled to report this week. The Earnings Explorer tool is available to all Institutional clients, so if you are not currently subscribed, start a two-week free trial to Bespoke Institutional for immediate access.
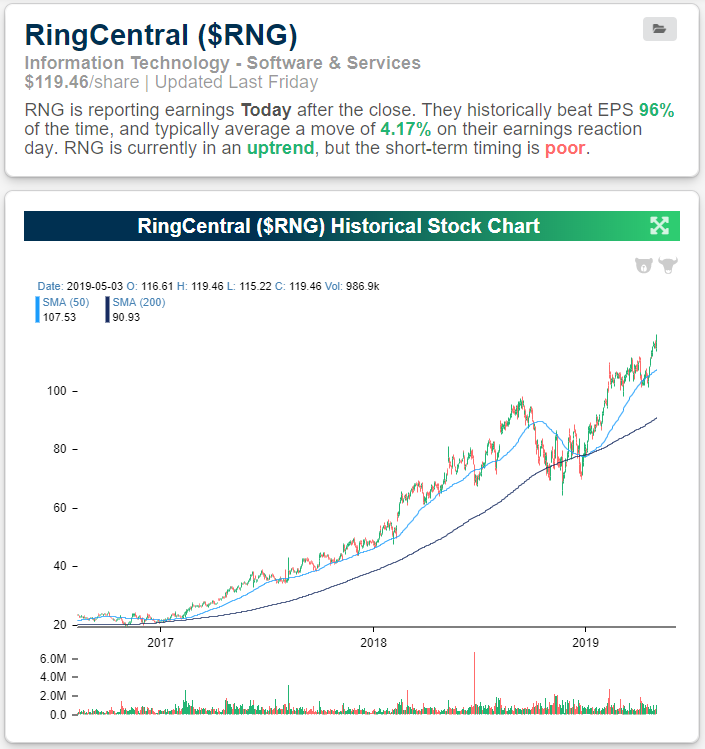
For starters, RingCentral’s (RNG) came public in 2013 and its first EPS report was in November 2013. Since then, the stock has never missed sales estimates and only missed EPS forecasts once (Q3 2015). The stock also recently reported a triple play (beat in EPS and sales estimates while raising guidance) two quarters ago. Investors have historically reacted well to the company’s reports averaging a gain of 4.17%. Heading into Monday’s report, the stock has been strong with a gain of 0.5% on a weak day for the market and a bullish engulfing of Friday’s close at new all-time highs.
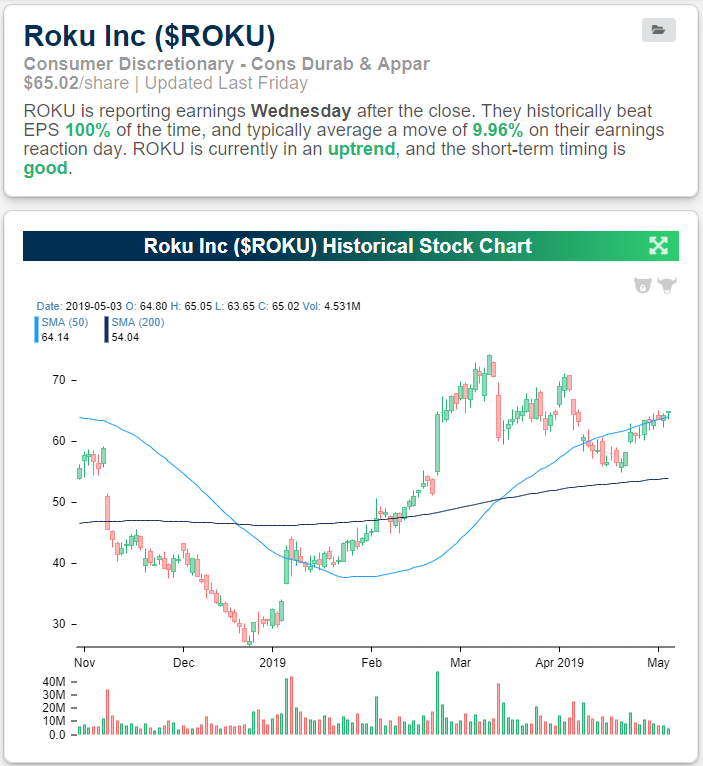
Roku’s (ROKU) streaming devices and services have become increasingly popular over the years and its popularity has shown in its earnings. Roku has beaten earnings and sales estimates each quarter since its first quarterly report in November of 2017. The stock has been pretty volatile in reaction to earnings, though, with an average move of 23.87%. Looking at just last quarter, the stock rose an astounding 25.23%, and the one before it fell by a similar degree (22.29%) in response to earnings. Fortunately for bulls, it has had a positive bias in reaction to earnings with an average gain of just under 10%. Looking at the chart of the stock this year, it has been in a solid uptrend but has recently faltered as it has been unable to make a new high since March. If the massive price movements in reaction to past reports are any indication, another solid jump on earnings could help to lift the stock at least closer to these previous highs (currently around 13% away from its March 11 peak).
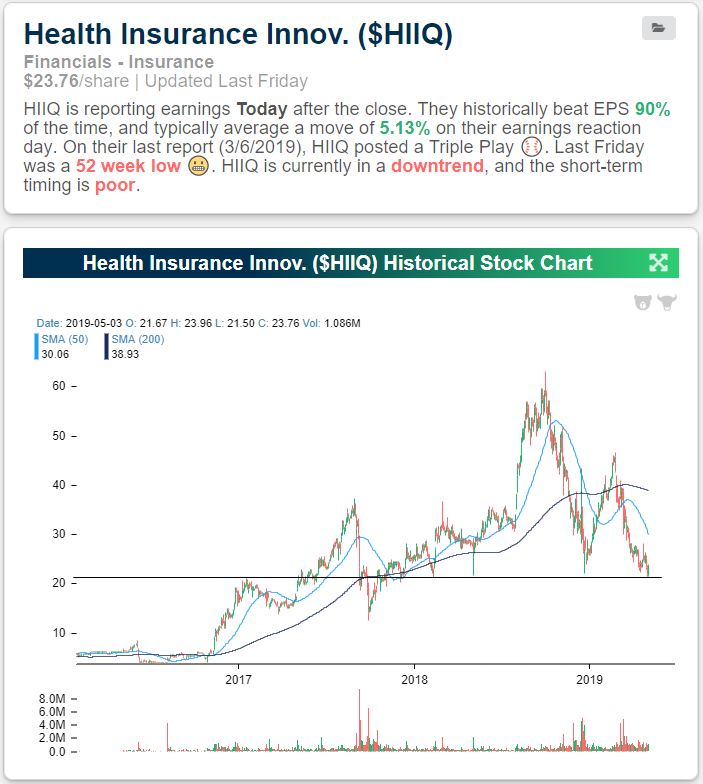
Health Insurance Innovations (HIIQ) may not be perfect like some other names, but the company still boasts a strong 90% beat rate for both sales and EPS. Last quarter, the company posted a triple play, the third one in its history and first since February 2018. While the stock averages a 5.13% gain on what has historically been solid earnings reports, the current trend is not great. HIIQ has fallen on hard times following last year’s volatility. It has been in a downtrend and has yet to retake last year’s highs like many other stocks. On Friday HIIQ, finished at a 52-week low. This low is a critical support level tracking back to early 2017 highs and lows throughout multiple points in 2018. In Monday’s trading ahead of earnings, like RNG, investors have been jumping on the stock. As of this writing, the stock is off of the day’s highs but still rallying around 12%.
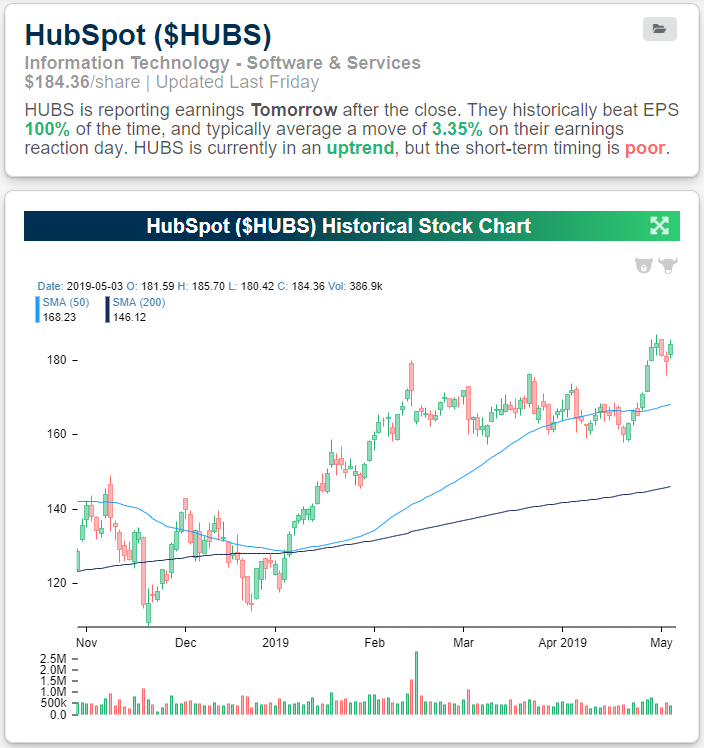
HubSpot (HUBS) has been flawless in its earnings history. On top of 100% beat rates for both earnings and EPS estimates, it has seen nine triple plays since its first report way back in 2014. The stock saw a solid rally from the start of the year through February but has had trouble making a break higher until a couple of weeks ago. In today’s trading, it is making another push towards a new 52-week high. With the stock averaging a gain of 3.35% in reaction to earnings, tomorrow’s report could act as a catalyst to bring it up to these levels.
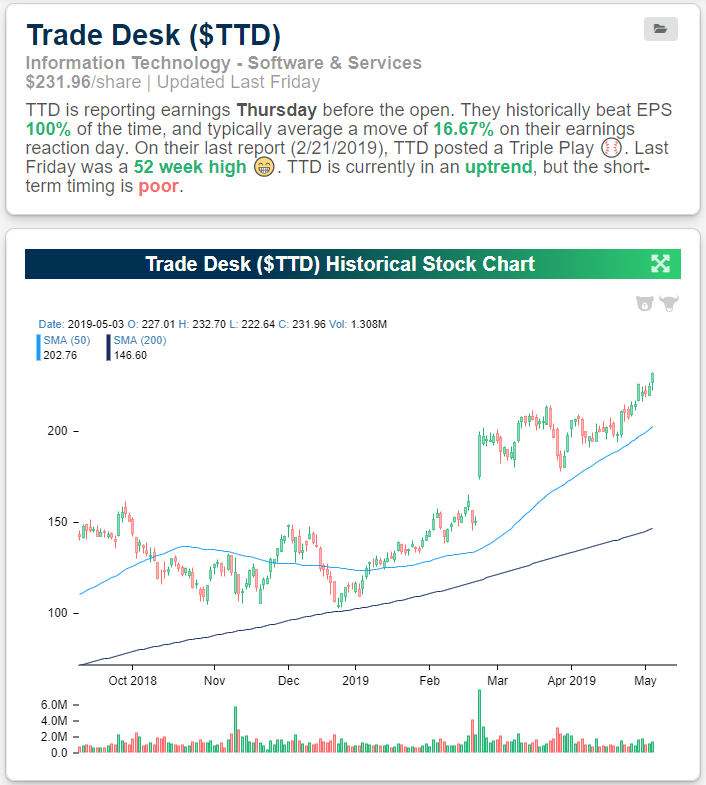
While HUBS has seen an impressive number of triple plays, Trade Desk (TTD) has perhaps been even more impressive. Of its 10 past reports, eight have been triple plays, and even in those two that weren’t triple plays, it topped EPS and sales estimates! Heading into its next EPS report this Thursday (5/9), the stock has a streak of five quarters of triple plays. The cherry on top: it has also averaged the second-best gain (16.67%) of all companies reporting this week. TTD certainly has an attractive earnings history with an uptrend to match. Of course, with such a strong history, expectations may be set high and any sort of miss could be met with an intensely negative reaction.
B.I.G. Tips – Apple (AAPL) Distances Itself From Technology
Last Big Week of Q1 Earnings Season
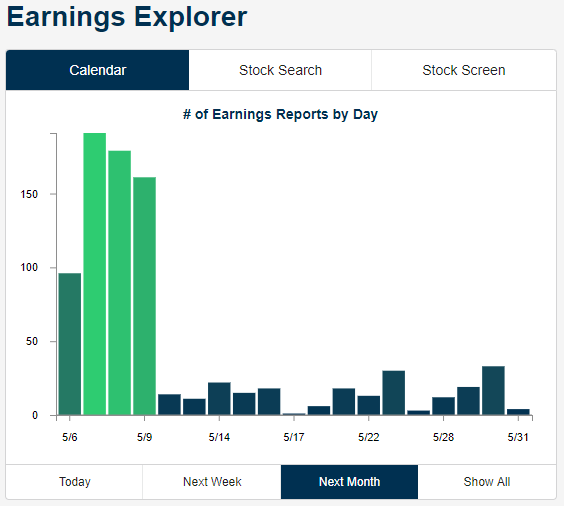
Below is a chart showing the number of earnings reports by day over the next month. As you can see, this week is the last big one for the Q1 earnings season, as the number of reports per day drops dramatically next week and beyond.
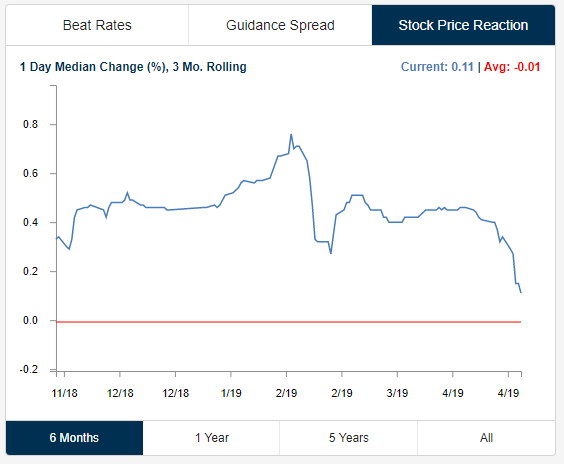
Stock prices have been reacting more negatively to earnings this season compared to recent quarters. Below is an updated look at the median one-day change that stocks are experiencing on their earnings reaction days on a rolling three-month basis. Over the last three months, stocks that have reported earnings have seen a median one-day gain of 0.11% in reaction to the news. While still positive, the current reading is much lower than where it was back in February when the median one-day gain was above 0.70%. Back in February, we were still in the early days of the post-correction rally, and investors were bidding up shares sharply after earnings after results showed that the Q4 market correction was likely overdone.
From our Earnings Explorer page available to Bespoke Institutional members, you can see which stocks have reacted the most positively or negatively to their earnings reports over any time frame. Below we show the stocks that have gained or lost more than 20% on their earnings reaction days this earnings season. Ironically, there have been 13 stocks that have gained 20%+ and 13 stocks that have fallen 20%+. Impinj (PI) and Zixi (ZIXI) have been the two biggest winners this season with one-day gains of more than 34%. ENPH, LOVE, and NUS round out the top five with gains of more than 26%. Other notable winners include Chinese companies CYOU and SOHU along with the “eBay of Latin America” — MercadoLibre (MELI).
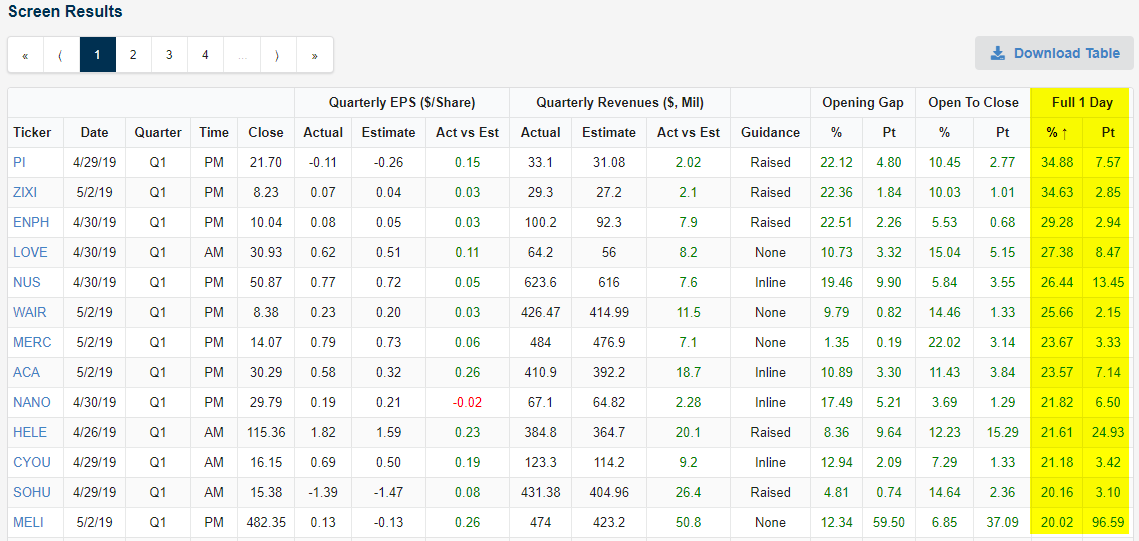
Consolidated Communications (CNSL) has been the biggest loser this season with a one-day decline of 34.2% on April 25th. Eventbrite (EB) ranks second worst with a drop of 27.12% on May 2nd, followed by ASTE, PBI, and FLR. Other notables on the list of biggest losers this earnings season include iRobot (IRBT), Frontier Communications (FTR), and MarineMax (HZO). Start a two-week free trial to Bespoke Institutional to access our Earnings Explorer tool and everything else on our website.

Morning Lineup – Here We Go Again!
Just when you thought the days of markets opening down sharply in reaction to an overnight headline concerning trade negotiations with China were over, we get this morning. There isn’t a whole lot of earnings data to contend with and the economic calendar is blank for today, so it looks like just three days after Kudlow decided to spike the ball in reaction to Friday’s NFP report, the President is shaking things up a bit with his tweet-storm last night.
US futures are set to open down over 1%, but the gains don’t look to be anywhere near as severe as what happened in China where the decline was more like 5%. Also, ever since the initial gap down, things have been extremely steady. Today’s decline is set to be the 9th gap down of 1% or more for the S&P 500 since the start of 2017, and in today’s Chart of the Day we looked at how the index performed following prior occurrences as well as what the catalyst for each decline was, so if you haven’t already seen it, check it out.
We’ve just published today’s Morning Lineup featuring all the news and market indicators you need to know ahead of the trading day. To view the full Morning Lineup, start a two-week free trial to Bespoke Premium.
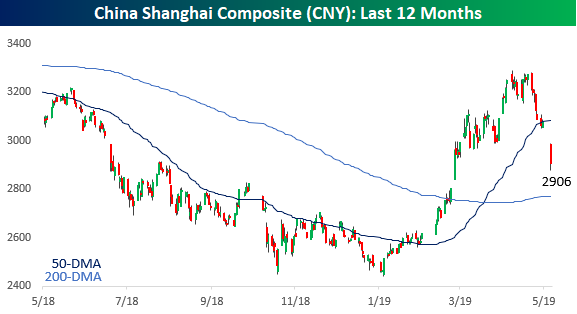
Last night’s sell-off in Chinese equities put a big dent into this year’s gains for the Shanghai Composite. With a drop of more than 5.5%, it was the largest one day decline for Chinese stocks since February 2016. Year to date, the Shanghai Composite is now up 16.54% on the year and has nearly cut this year’s gains in half. More noteworthy is the fact that with the S&P 500 up 17.5% YTD heading into today, the US is now outperforming Chinese stocks YTD. Obviously, with futures down over 1%, the US lead may not last for long, so we’ll have to see how things shake out over the course of the trading day.
Start a two-week free trial to Bespoke Premium to see today’s full Morning Lineup report. You’ll receive it in your inbox each morning an hour before the open to get your trading day started.