Beats Across the Board
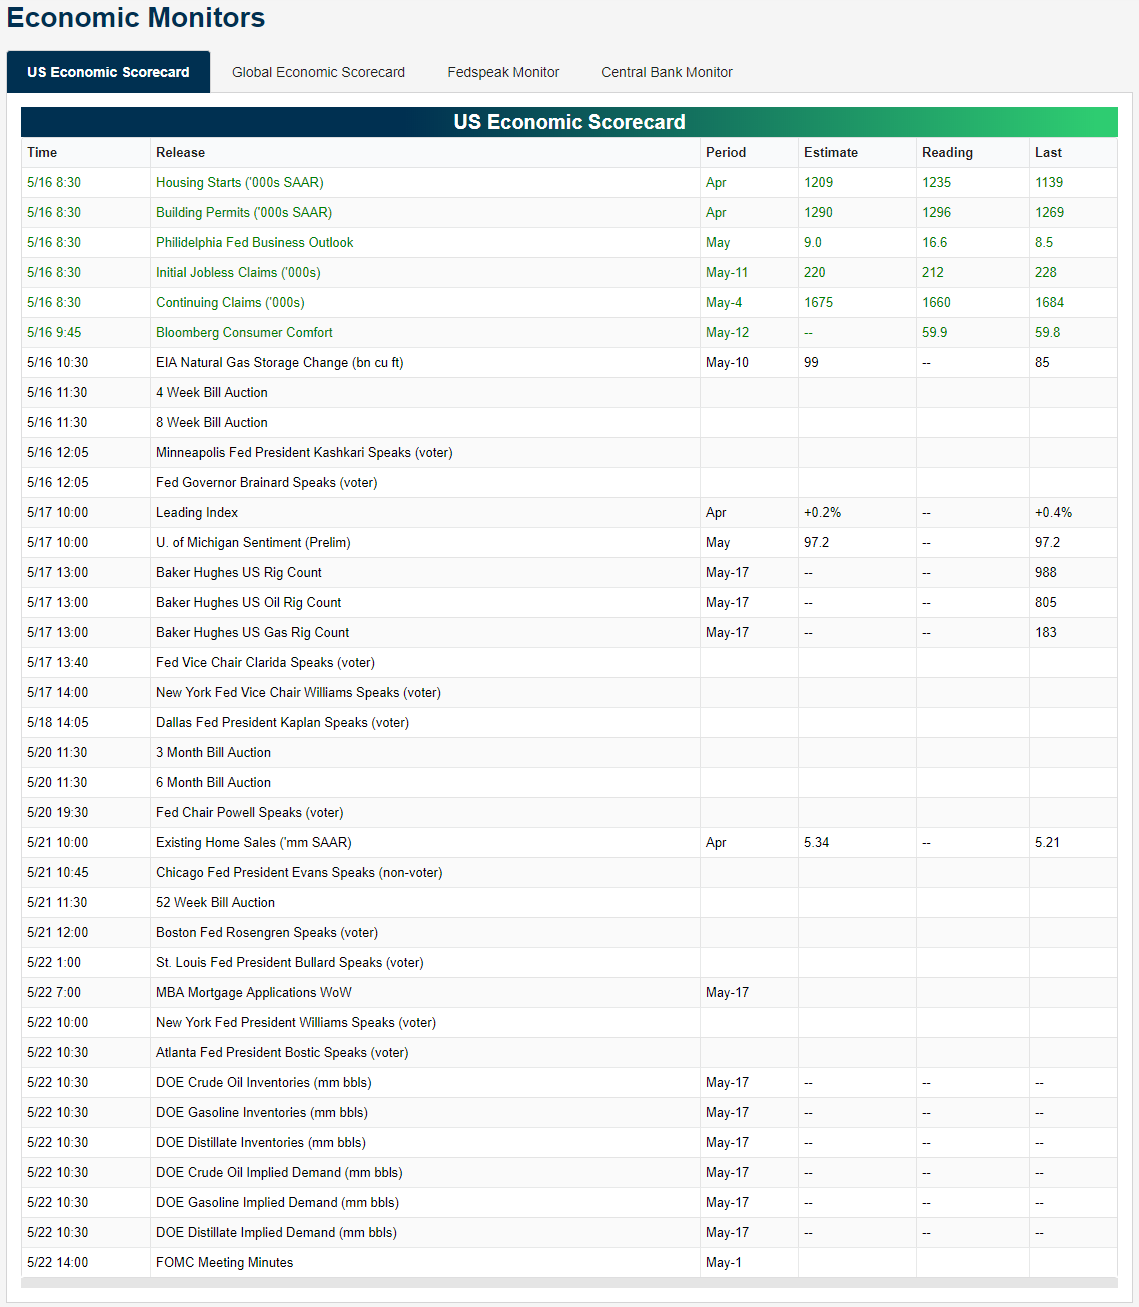
It has been a pretty busy morning in terms of economic data with six releases already out. The results: beats across the board. Not a single US indicator today has come in worse than expectations/the prior period. At 8:30, we got some housing data with both Housing Starts and Building Permits for the month of April. Each one were expecting an uptick, but the actual releases rose by even more than anticipated. In The Closer tonight, we’ll discuss some of the reasons that the headline was much stronger than the underlying details. The Philly Fed also released its Business Outlook Index at 8:30. After a reading of 8.5 in April, forecasts were calling for a moderate rise to 9. Instead, it crushed estimates rising to 16.6 for the month of May. Turning to some weekly releases, initial jobless claims and continuing claims both fell more than was anticipated while optimism, as seen through Bloomberg’s Consumer Comfort, rose modestly. Still on deck later today, we have two weekly bill auctions in addition to scheduled speeches from Minneapolis Fed President Kashkari and Fed Governor Brainard. Given Brainard is a voting FOMC member and Kashkari is an alternate voter, markets will monitor their words for hints of what might be to come in terms of monetary policy.
Institutional clients can stay up to date on today’s and the next week’s economic releases for the US and the rest of the globe with our Economic Monitors. Below is a snapshot from the US Economic Scorecard. Start a two-week free trial to Bespoke Institutional to access our interactive economic indicators monitor and much more.
Claims Grind Lower
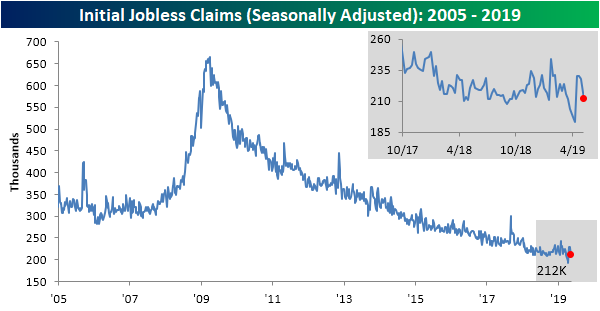
It has been a pretty solid morning in economic data as every release so far has beaten estimates. That includes Initial Jobless Claims which came in at 212K this week versus expectations of 220K. Not only was this below estimates, but the indicator has now come back down from its relatively elevated levels from the past three weeks in which we had seen two readings of 230K and another of 228K. Additionally, this week marked the 70th consecutive week of the indicator sitting under 250K and the 219th week below 300K.
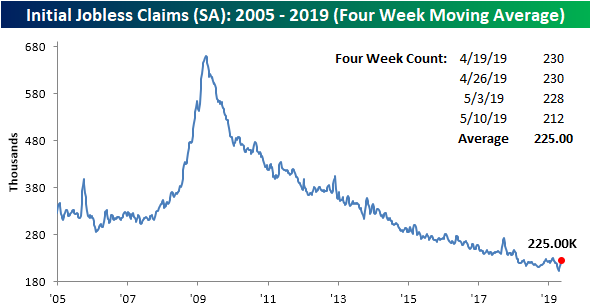
Four weeks ago, claims came in at its lowest print in a half-century for both the seasonally adjusted number and the four week moving average. This week that low of 193K in the SA number has rolled off of the moving average, leading the less volatile look at the data to tick up to 225K from 220.3K last week. The moving average has risen for four straight weeks from its lowest level of the cycle, now sitting 23.5K above this recent low.
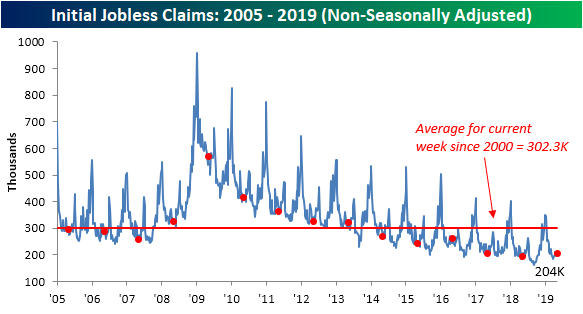
On a non-seasonally adjusted basis, the data still appears healthy as it dropped down to 187.7K from 204K last week. That is the second lowest reading of 2019 (lowest was 183.8K for the final week of March) and it also sits well below the average for the current week of the year since 2000. One trend we made note of last week was the increasing number of weeks with a YoY increase in the NSA number. This week’s decline snapped a streak of three straight prints with a YoY increase. Start a two-week free trial to Bespoke Institutional to access our interactive economic indicators monitor and much more.
Morning Lineup – Strong Economic Data For a Change
It’s been a while since we last had a busy day of economic data and every report came in better than expected, but that’s exactly what happened today as Housing Starts, Building Permits, Jobless Claims, and the Philly Fed Manufacturing reports all topped expectations. Even the sun is shining over the New York Stock Exchange! Somebody pinch us and make sure we’re not dreaming!
We’ve just published today’s Morning Lineup featuring all the news and market indicators you need to know ahead of the trading day.

In yesterday’s Retail Sales report, one negative trend we noticed was the sharp drop in sales for Building Materials from their recent highs. As shown in the chart below, sales for the sector have dropped over 6% from their recent highs in what has been the largest decline from a 52-week high since 2012. While that sounds like it has ominous implications for the construction sector, one contributing factor behind the weakness may be the weather. With wet weather across the country this year, people have no doubt been slow to start Spring gardening projects and that means fewer visits to their local Home Depots or Lowe’s.

Start a two-week free trial to Bespoke Premium to see today’s full Morning Lineup report. You’ll receive it in your inbox each morning an hour before the open to get your trading day started.
The Bespoke 50 Top Growth Stocks
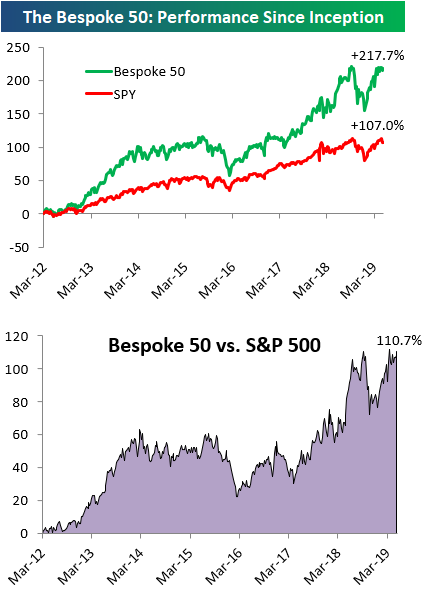
Every Thursday, Bespoke publishes its “Bespoke 50” list of top growth stocks in the Russell 3,000. Our “Bespoke 50” portfolio is made up of the 50 stocks that fit a proprietary growth screen that we created a number of years ago. Since inception in early 2012, the “Bespoke 50” has beaten the S&P 500 by 110.7 percentage points. Through today, the “Bespoke 50” is up 217.7% since inception versus the S&P 500’s gain of 107.0%. Always remember, though, that past performance is no guarantee of future returns.
To view our “Bespoke 50” list of top growth stocks, please start a two-week free trial to either Bespoke Premium or Bespoke Institutional.
The Closer — Outside Up Day, Chinese Trade Exposure, Industrial Production, Flows — 5/15/19
Log-in here if you’re a member with access to the Closer.
Looking for deeper insight on markets? In tonight’s Closer sent to Bespoke Institutional clients, we begin with a technical update of today’s price action where the S&P 500 saw an outside day as well as back-to-back gains from open-to-close. We look at forward returns to these patterns before turning to macro data. First we put some perspective on some of the talking points around China and trade. We then look at today’s release of Industrial Production. We finish with our weekly looks at EIA petroleum data and ICI fund flows.

See today’s post-market Closer and everything else Bespoke publishes by starting a 14-day free trial to Bespoke Institutional today!
Fixed Income Weekly – 5/15/19
Searching for ways to better understand the fixed income space or looking for actionable ideals in this asset class? Bespoke’s Fixed Income Weekly provides an update on rates and credit every Wednesday. We start off with a fresh piece of analysis driven by what’s in the headlines or driving the market in a given week. We then provide charts of how US Treasury futures and rates are trading, before moving on to a summary of recent fixed income ETF performance, short-term interest rates including money market funds, and a trade idea. We summarize changes and recent developments for a variety of yield curves (UST, bund, Eurodollar, US breakeven inflation and Bespoke’s Global Yield Curve) before finishing with a review of recent UST yield curve changes, spread changes for major credit products and international bonds, and 1 year return profiles for a cross section of the fixed income world.
In this week’s report we review relative value in US interest rate markets and swaption implied volatilities.

Our Fixed Income Weekly helps investors stay on top of fixed income markets and gain new perspective on the developments in interest rates. You can sign up for a Bespoke research trial below to see this week’s report and everything else Bespoke publishes free for the next two weeks!
Click here and start a 14-day free trial to Bespoke Institutional to see our newest Fixed Income Weekly now!
Homebuilders Get Happy
Homebuilder sentiment saw a stronger than expected increase in May as the NAHB sentiment survey rose more than expected to 66 from 63 and expectations of 64. Even after this month’s increase, sentiment remains well off its cycle high of 74 from December 2017, but it does erase much of the swift leg lower we saw in Q4 of 2018.

Looking at a breakdown of this month’s report by sales, traffic, and regional trends, gains were broad-based. The only category that didn’t see a boost was sentiment in the Midwest. Present Sales saw the biggest increase in terms of sales and traffic trends, and like the headline index, these categories remain well off their cycle highs but have mostly erased their Q4 declines.
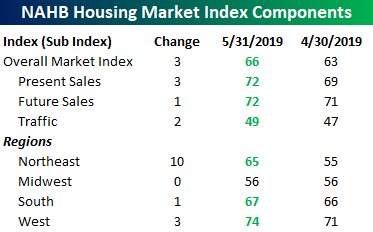
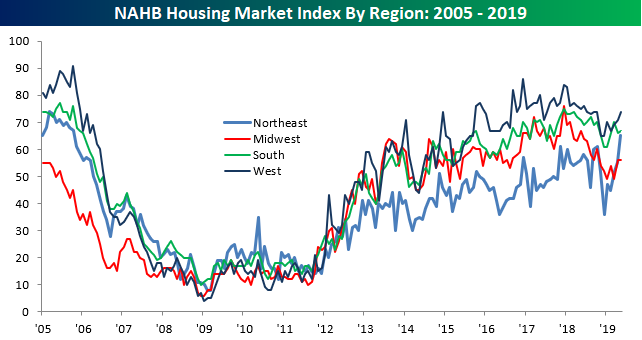
In terms of regional sentiment, the Northeast saw the largest jump, increasing by ten full points to 65. With that gain, sentiment in the Northeast region is now at its highest level since 2005. It’s also only the fourth month since 2013 where the Northeast didn’t have the lowest sentiment of any region. Now, imagine what would happen to sentiment in the region if the sun ever came out! If you haven’t ever done so before, now is the perfect time to start a two-week free trial to Bespoke Institutional to access all of our thought-provoking investment research and interactive investor tools.
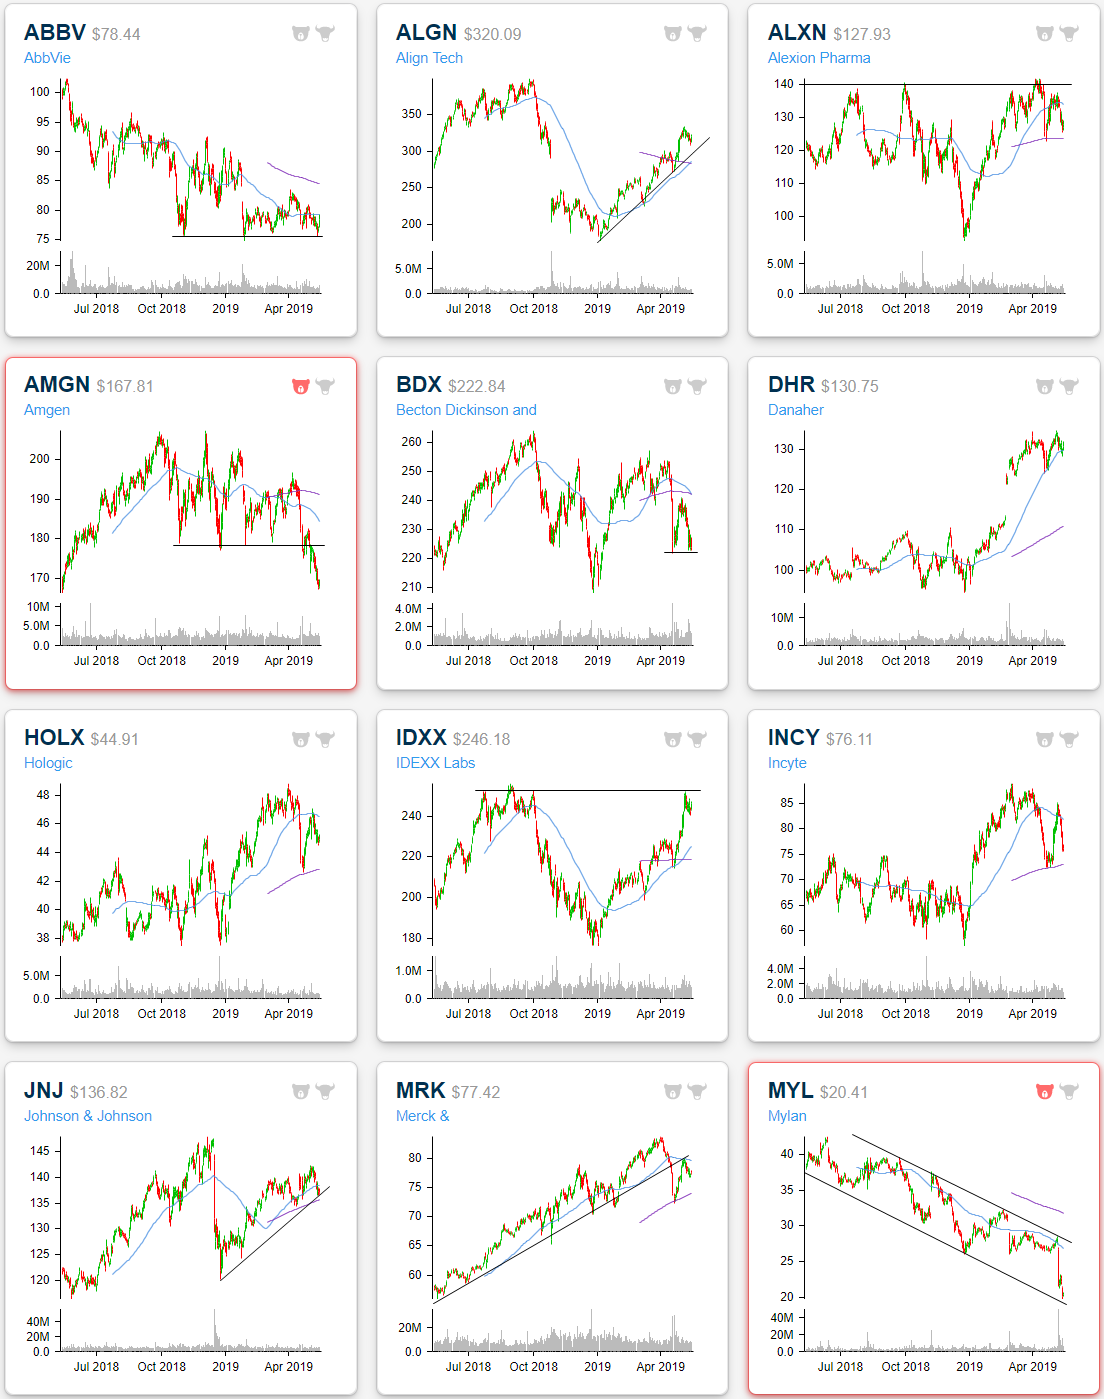
Sector Charts – 5/15/19 – Health Care
While the past couple weeks of declines have eaten into YTD gains, a majority of the S&P 500 sector ETFs are still seeing double-digit or at least high single-digit returns. That is not the case for Health Care (XLV). Health Care has been and continues to be a drastic underperformer this year, now only up 1.35% since the start of the year. Using our Chart Scanner tool, below we highlight some individual charts from within the sector.
Align Tech (ALGN) has been in a solid uptrend all year, avoiding the more substantial declines that the rest of the sector has seen. Currently, it boasts the greatest YTD performance of the Health Care stocks in the S&P 500 with a 52.84% gain. Along with the broader market, in the past couple of weeks ALGN has pulled back providing a good chance to buy the dip. Similarly, Danaher (DHR) and Johnson & Johnson (JNJ) are also seeing pullbacks in their uptrends along with constructive trading in regards to their moving averages. In late April DHR pulled back to the 50-DMA before breaking out to new highs, and it has just bounced off of the moving average again. JNJ similarly has pulled back recently in this year’s uptrend but is finding support at the 200-day. In today’s trading, the stock has fallen to and rallied off of the 200-DMA. This happened two other times earlier this year, once about a month ago and again in mid-February, in which JNJ saw a solid rally afterward.
A few other names are seeing interesting trading in regards to moving averages. Hologic (HOLX), Incyte (INCY), and Merck (MRK) all collapsed right through the 50-DMA in early April when the sector fell sharply. All three found support at the 200-DMA before rallying back up to the 50-DMA. But this time around, the 50-DMA has been a bit more meaningful as it has been tough resistance. After running up to it, all three stocks have fallen and are now in the middle of the range between the two moving averages. Each will be interesting to watch as they re-approach either average to the up or downside.
Some other Health Care names are at interesting points of resistance and support. For starters, AbbVie (ABBV) just reported a triple play at the end of April. In spite of this more optimistic fundamental point, the stock is still forming a descending triangle pattern, reaching the floor of support around $75 for the third time this year in the past few days. Going forward either a break higher through its downtrend line or a break down below support would be two things to watch for, and right now it appears it could do either. Conversely, IDEXX Labs (IDXX) has been skyrocketing since its earnings report. It is now re-approaching last year’s highs. Over the past few weeks, it stopped short of these levels pulling back slightly and now it has begun to move back up to these prior highs. IDXX now has the potential to break out higher in a cup and handle pattern.
Some of the less promising looking setups include Mylan (MYL) and Amgen (AMGN). Both of these stocks have seen the rug get pulled out from under them recently in the time leading up to and in response to their earnings reports. Regardless of the fundamental pictures seen in these reports, investors have not been acting kindly. For the fifth time in the past year, AMGN ran into support around the upper $170’s. This time around it was not able to hold onto these levels. MYL meanwhile has been in a solid long term downtrend for multiple years now. This most recent drop has brought it to its lowest levels since 2011 and to the bottom of its downtrend channel. Start a two-week free trial to Bespoke Institutional to access our interactive Chart Scanner tool and much more.
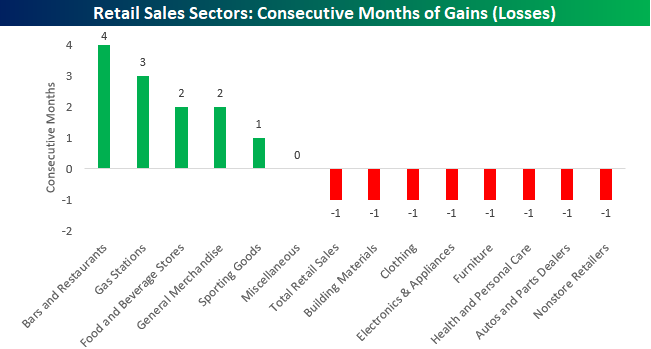
B.I.G. Tips – Retail Sales Disappoint Again
Retail Sales for the month of April were released earlier today and came in weaker than expected across the board. If there was a bright spot in the report it was that March’s report was revised higher. Of the fourteen sectors that comprise total sales, seven saw declines, one was unchanged, and five saw m/m growth. In the chart below, we show the number of consecutive months that each sector has shown growth or declines. While more sectors saw m/m declines in sales growth than gains in April, none of them have seen back to back declines. On the positive side, Bars & Restaurants (where millennials tend to spend) has seen sales growth for four straight months, while Gas Stations is rising a streak of three straight months of gains. Given the fact that prices at the pump just recently came off of a record streak without declines, that shouldn’t come as too much of a surprise either.
We just published our monthly update to key trends in this month’s Retail Sales report. To see the report, sign up for a monthly Bespoke Premium membership now!