Chart of the Day: Pessimistic AAII Points to Positive Performance
B.I.G. Tips – Market and Economic Sentiment Diverge
We’ve just published a B.I.G. Tips report that provides a full update of our composite economic and market sentiment charts that are highlighted in our annual Bespoke Report each year.
While the stock market typically follows the economy, one would expect that sentiment towards the two would be similar. As we have seen over time, though, that is far from always the case. Our composite indicators take a number of different economic and stock market sentiment indicators and combines them into one key reading of sentiment. Currently, both of these indicators are showing entirely different outlooks. To read our newest report and see the latest updates to our sentiment indices, start a two-week free trial to Bespoke Premium!

Jobless Claims Hold
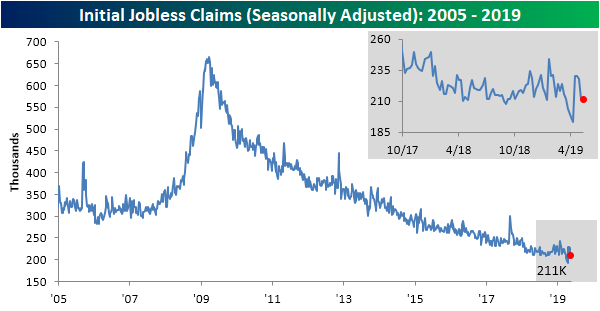
Weekly jobless claims released this morning came in at 211K, which was below expectations of 215K and the 212K reading last week. The seasonally adjusted number has now spent 71 straight weeks below 250K and 220 consecutive weeks below 300K. Start a two-week free trial to Bespoke Institutional to access our interactive economic indicators monitor and much more.
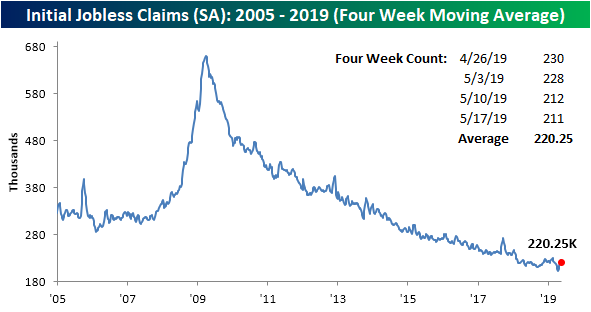
After rising to 225K last week, the four-week moving average also saw a modest decline. The moving average fell to exactly where it was at the start of the month (220.3K). This comes as one of the recent highs of 230K has rolled off of the average. Turning to next week, assuming we see a similar print to this week, another data point of 230K will fall out of the average, so we may see another drop in the four-week average as well.
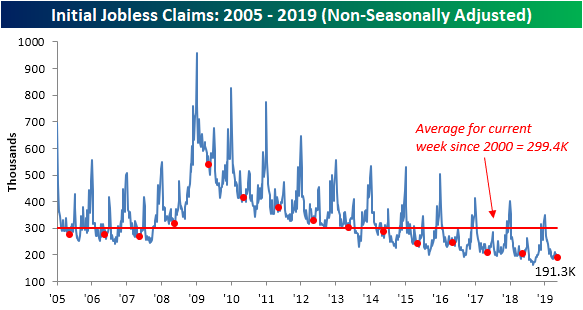
As per usual, non-seasonally adjusted (NSA) jobless claims came in well below the average for the current week since 2000. At 191.3K, NSA claims are over 100K below this average. This week’s print is also the lowest for the current week of the year of the current cycle and going back to at least 2000. With this new low for the current week of the year, the past couple of weeks’ releases have been a welcome change from the YoY increases in the NSA data that has been frequently observed this year.
Overall, the data has been somewhat mixed recently. Though initial claims more or less held steady this week, continuing claims saw the opposite result as they rose from the previous week and missed forecasts with a print of 1,676K (1,666K expected). While initial claims appear to still be chugging along just fine (YoY increases aside), continuing claims still have not made a new low since last October. That is not necessarily a horrendous thing for either considering the data has also not rocketed higher by any stretch, but it does confirm that the pace in claims falling has somewhat slowed relative to previous years.
B.I.G. Tips – Homebuilders Holding Up Well
New Low For Bullish Sentiment
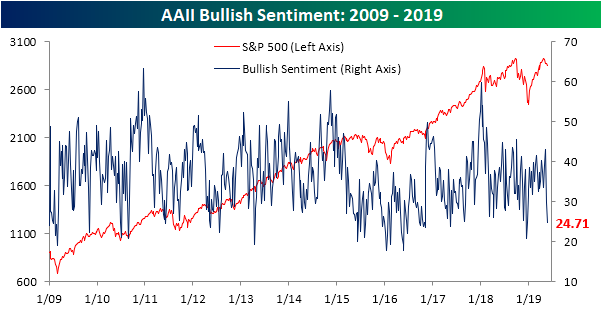
Trade headlines have continued to have a negative impact on stock prices, and in turn sentiment levels, over the past week. The AAII investor sentiment survey saw bullish sentiment decline sharply once again this week falling to 24.71% compared to 29.82% last week. To think that just two weeks ago bullish sentiment was at 43.12%, which was the highest reading of the year. Falling 18.41% from this recent high, the current decline is the largest two-week drop in bullish sentiment since 6/6/13 when it fell 19.5% over the two previous weeks. Start a two-week free trial to Bespoke Institutional to access our interactive economic indicators monitor and much more.
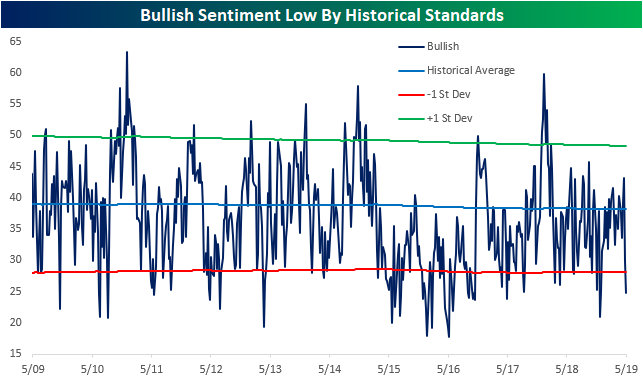
But this is not necessarily all bad news from a contrarian perspective. As shown in the chart below, this week’s reading of 24.71% is well below the historical average of 38.21%. In fact, it is over 1 standard deviation below it, something that can be considered a bit extreme and raising expectations for some type of mean reversion. When bullish sentiment reaches an extreme low by historical standards, forward equity market performance has typically been stronger than average. The last time survey respondents showed this little optimism was in late December of last year; right around the time of the market bottom.
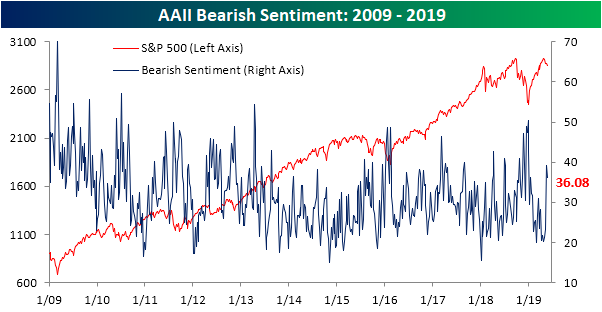
Surprisingly, while there was this development in bullish sentiment, bearish sentiment actually fell to 36.08% versus 39.3% last week. So while still elevated from where it has been for much of this year as the market has rallied, bearish sentiment is not reaching new highs. It is also still above its historical average but not to an extreme degree.
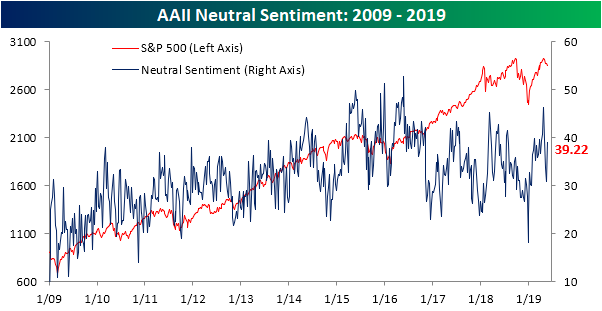
Neutral sentiment took from the losses in the bullish and bearish camps as it rose to 39.22%. While this sounds high, there was actually a slightly higher reading at the beginning of the month and this brings the neutral reading off of its recent lows and more in line with what has been observed for most of this year.
The Bespoke 50 Top Growth Stocks
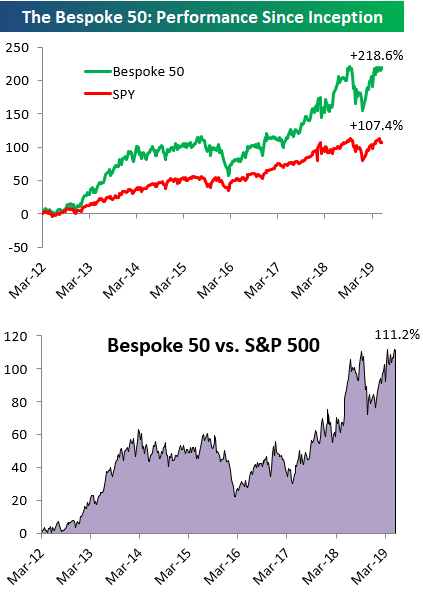
Every Thursday, Bespoke publishes its “Bespoke 50” list of top growth stocks in the Russell 3,000. Our “Bespoke 50” portfolio is made up of the 50 stocks that fit a proprietary growth screen that we created a number of years ago. Since inception in early 2012, the “Bespoke 50” has beaten the S&P 500 by 111.2 percentage points. Through today, the “Bespoke 50” is up 218.6% since inception versus the S&P 500’s gain of 107.4%. Always remember, though, that past performance is no guarantee of future returns.
To view our “Bespoke 50” list of top growth stocks, please start a two-week free trial to either Bespoke Premium or Bespoke Institutional.
Morning Lineup – More Bad Trade Headlines
The back and forth action of the market lately in response to trade headlines related to China is really getting tiresome. Today, the narrative is negative as futures have been trending lower all night and into this morning. While we’ve seen a small bounce since 6:00 AM NY time (when things started to head south yesterday) we’re still deep in hole relative to yesterday’s close. Jobless Claims were just released and came in slightly lower than expected (211K vs 215K).
Be sure to check out today’s report for a recap of all the US and major European earnings reports overnight, the latest releases of flash PMIs for May, and some European data that was actually positive. How about that!

We mentioned that the constant whipping around of the markets has become tiresome. To illustrate just how much US equities have been getting tossed around lately based on overnight headlines, the chart below shows the 20-trading day average of the opening gap for the S&P 500 ETF (SPY). Including today’s weakness, over the last 20 trading days, SPY has averaged an opening gap to the downside of 0.36%. As shown in the chart, this hasn’t happened too often in the period since the financial crisis. In fact, the last time it occurred was in August 2015 (China issues again) and before that 2011 (US debt downgrade)!

While the S&P 500’s opening print has tended to be extremely weak over the last four weeks, investors have spent most of the trading day buying the weakness. As shown in the chart below, the S&P 500’s average change from the open to close has been a gain of 0.22%. That hasn’t been enough to erase the opening losses, but it has managed to keep the market’s declines in check.

Start a two-week free trial to Bespoke Premium to see today’s full Morning Lineup report. You’ll receive it in your inbox each morning an hour before the open to get your trading day started.
Equities Struggling Globally
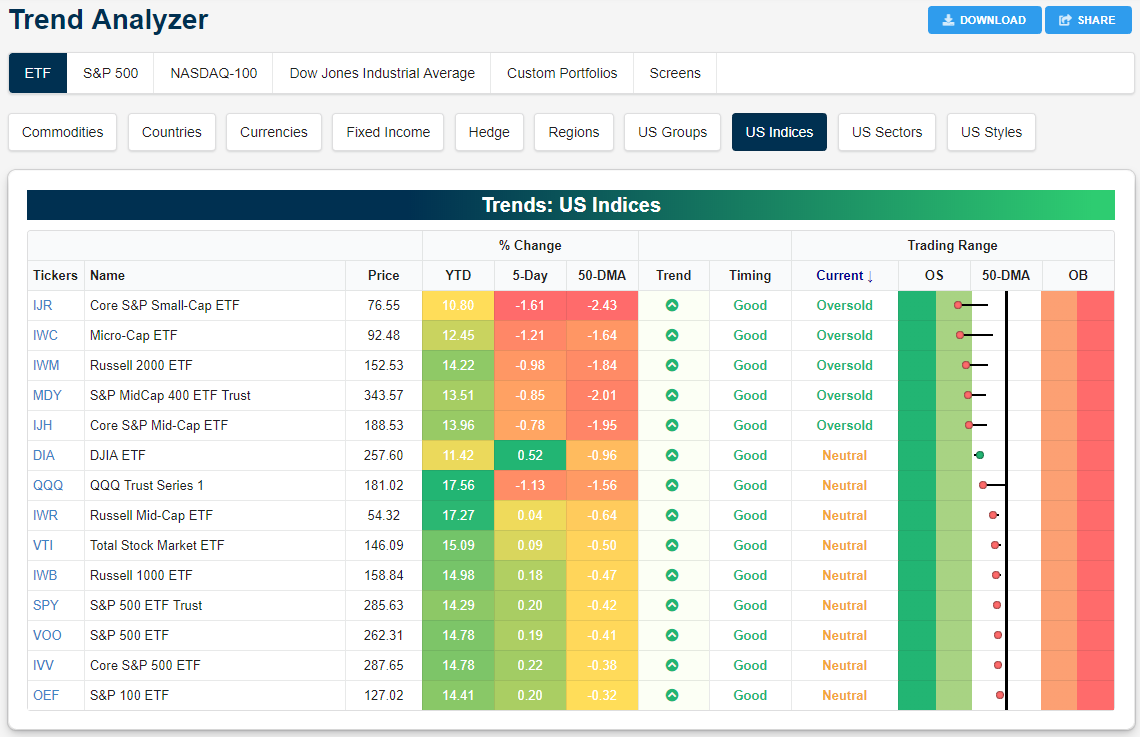
US equity futures are pointed lower once again this morning with the S&P 500 SPY ETF trading down more than 80 basis points pre-market. This morning’s weakness exacerbates what was already a weakened position heading into this morning. As shown in our Trend Analyzer snapshot of US index ETFs below, every one of them is already trading below its 50-day moving average. Both small and mid-caps are in oversold territory trading more than one standard deviation below their 50-DMAs. Of the large-cap ETFs, the Dow 30 (DIA) and Nasdaq 100 (QQQ) are the closest to oversold, while SPY is only slightly below its 50-DMA by 0.42%.
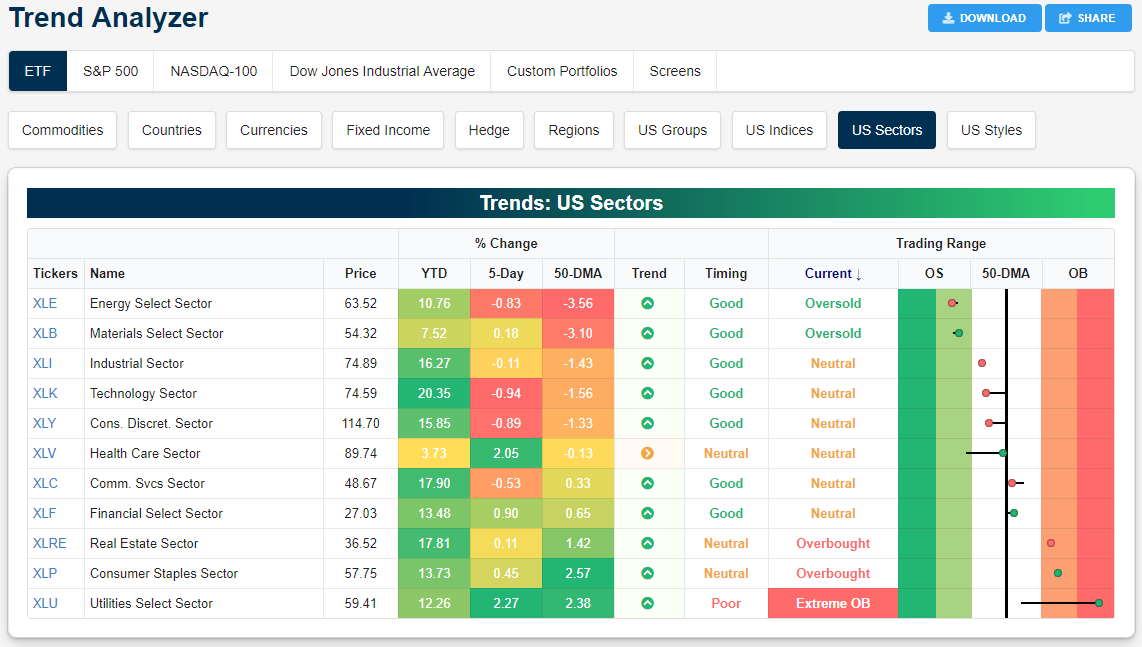
A quick look at where S&P 500 sector ETFs are trading shows the defensive posture that investors have taken recently. Cyclical sectors like Energy, Materials, Industrials, Technology, and Consumer Discretionary are all below their 50-day moving averages, while Real Estate, Consumer Staples, and Utilities — all defensives — are the only sectors trading in overbought territory. Utilities (XLU) has seen massive buying over the last week, moving higher by 2.27% into extreme overbought territory (>2 standard deviations above its 50-DMA).
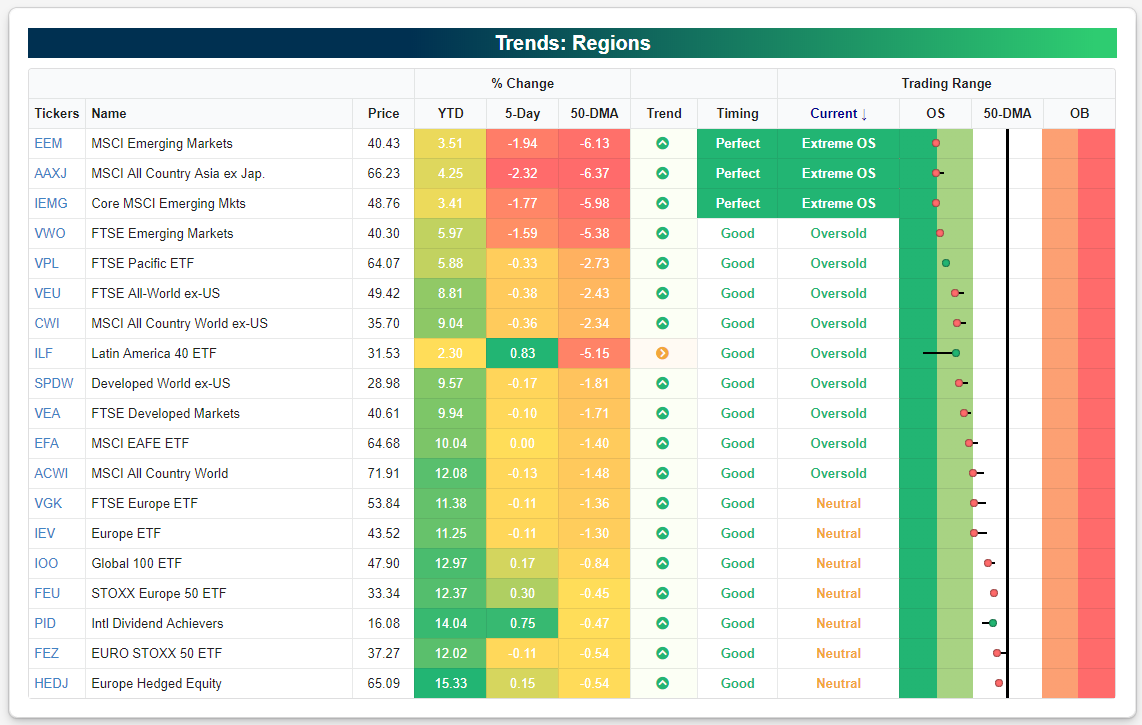
It’s a similar situation globally. Every one of the regional ETFs tracked in our Trend Analyzer tool are below their 50-day moving averages, and more than half are in oversold territory. Three are at extreme levels on the downside — two emerging markets ETFs (EEM, IEMG) and the All Country Asia ex Japan ETF (AAXJ). The Europe Hedged Equity ETF (HEDJ) is the closest to its 50-DMA at -0.54%. Start a two-week free trial to Bespoke for full access to our research tool-kit.
The Closer – Minutes, Commodities, Flows, Crude Inventories- 5/22/19
Log-in here if you’re a member with access to the Closer.
Looking for deeper insight on markets? In tonight’s Closer sent to Bespoke Institutional clients, we review today’s release of the FOMC’s April 30th-May 1st meeting minutes. On the topic of commodities, we take a look at the underperformance of commodity-related equities. We also highlight the relationship between agricultural commodities and delinquency rates of farm loans. Next, we provide an update to this week’s ICI fund flow data and show what flows may look like going forward. We finish with our recap of weekly EIA data.

See today’s post-market Closer and everything else Bespoke publishes by starting a 14-day free trial to Bespoke Institutional today!
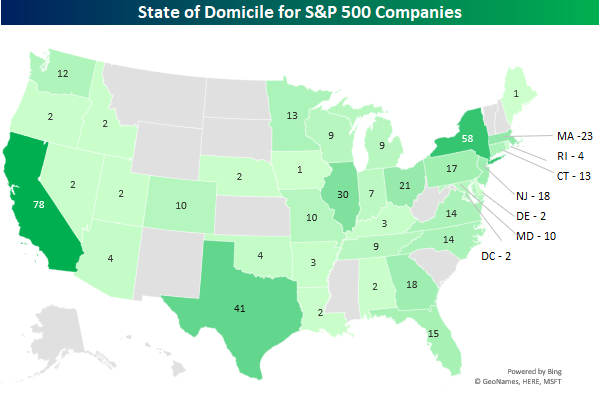
S&P 500 Company Performance By State
The map below provides a color-coded breakdown of the number of S&P 500 companies domiciled in each state across the USA. Not surprisingly, the biggest states in terms of population tend to have the largest number of S&P 500 companies headquartered in them. Leading the way, 78 companies are domiciled in California, followed by New York with 58, and Texas with 41. Meanwhile, there are 13 states which are home to no S&P 500 companies, including Alaska and Hawaii. In the case of those two states, the difference in time zone makes it understandable that no S&P 500 companies are headquartered there, but one would think a company with a name like Alaska Air would at least be located in Alaska, right? Illinois, which arguably has among the shakiest finances of any state, is home to 30 S&P 500 companies and that’s the fourth most even though it is only the sixth largest state. Among the biggest outliers, though, is Florida. Even though it has the third largest population of any state, only 15 S&P 500 companies call it home, ranking it all the way down at number ten. Start a two-week free trial to Bespoke for full access to our research.
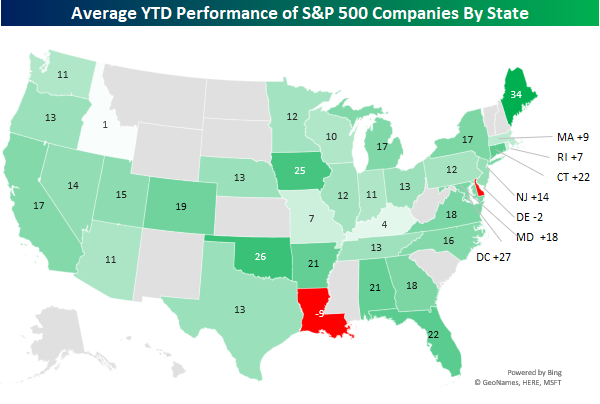
While the chart above shows the number of S&P 500 companies located in each state, the chart below shows the average YTD performance of the S&P 500 companies by state. Before going any further here, though, it is important to point out that these numbers can be a bit misleading since some states have a large number of companies while others just have one or two, thereby skewing the averages. With that in mind, Maine is the first state the sun touches each day, and it is also home to IDEXX Labs (IDXX) which is up 34% YTD, ranking it first of the 50 states. While Florida underperformed a bit in terms of the number of companies headquartered there, the average return of those companies is 22% YTD, ranking near the top in terms of states on the east coast.
Moving on to the midwest, the 30 companies headquartered in Illinois have underperformed the S&P 500 with an average gain of just 12% YTD. Further South, the fact that Louisiana (LA) is home to just two companies and one of them is Centurylink (CTL), which has declined 32% this year, makes it the state with the worst average return in the country. Right next door, Texas (TX) has a lot of exposure to the Energy sector among the 41 companies headquartered there and that has been a bit of a weight on its average YTD return of 13%. Finally, the dominance of Technology in California (CA) has the average stock headquartered in that state up 17% YTD as companies like Cadence (CDNS), Advanced Micro (AMD), and Facebook (FB) are all up over 40%.