Bespoke’s Global Macro Dashboard — 3/11/20
Bespoke’s Global Macro Dashboard is a high-level summary of 22 major economies from around the world. For each country, we provide charts of local equity market prices, relative performance versus global equities, price to earnings ratios, dividend yields, economic growth, unemployment, retail sales and industrial production growth, inflation, money supply, spot FX performance versus the dollar, policy rate, and ten year local government bond yield interest rates. The report is intended as a tool for both reference and idea generation. It’s clients’ first stop for basic background info on how a given economy is performing, and what issues are driving the narrative for that economy. The dashboard helps you get up to speed on and keep track of the basics for the most important economies around the world, informing starting points for further research and risk management. It’s published weekly every Wednesday at the Bespoke Institutional membership level.
You can access our Global Macro Dashboard by starting a 14-day free trial to Bespoke Institutional now!

Stocks for the COVID Economy
For clients, we’ve put together a COVID Economy portfolio that can be used as an idea generator for stocks to own in the current environment. While there are plenty of other ‘virus’ stocks that have attracted investor interest in recent weeks, we feel these names are not only more established, but in many cases, they also stand to benefit once we’re past the acute phase of the outbreak because of the potential long-term impact this experience will have on the behavior/psyche of the general public. To view the 21 stocks for the COVID Economy, simply start a two-week free trial to any of our three membership levels.
Bespoke’s Morning Lineup – 3/11/20 – Two Steps Forward, Three Steps Back
See what’s driving market performance around the world in today’s Morning Lineup. Bespoke’s Morning Lineup is the best way to start your trading day. Read it now by starting a two-week free trial to Bespoke Premium. CLICK HERE to learn more and start your free trial.
The wild volatility in financial markets continues this morning as the S&P 500 is on pace to give up most of yesterday’s gains right at the open. Where we go from there is anybody’s guess. As we have been noting for some time, volatility isn’t going anywhere in the short-term as headlines drive stocks violently in both directions.
Read today’s Bespoke Morning Lineup for a discussion of last night’s Democratic primaries, the latest updated figures on the coronavirus, and a recap of Asian and European markets.

After last night’s Democratic primaries, Joe Biden has all but wrapped up the nomination, and in a head to head matchup for the Presidency, it’s close to a dead heat. Trump’s odds of re-election have dropped to 50% in recent weeks while Biden’s chances have surged as he has racked up delegates.

The Closer – Turnaround Tuesday, But Corporates Are Cancelled – 3/10/20
Log-in here if you’re a member with access to the Closer.
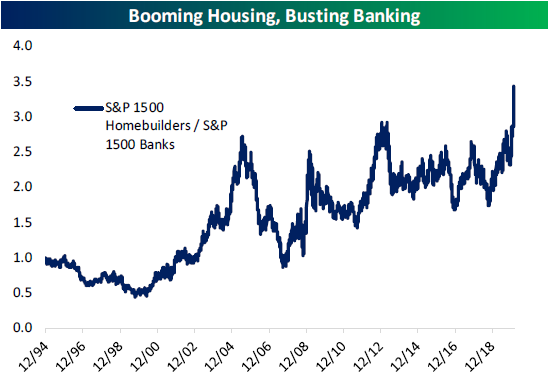
Looking for deeper insight on markets? In tonight’s Closer sent to Bespoke Institutional clients, we begin with a look at the internals of today’s rally and what the move in corporate bonds have looked like. We then show what the effect falling rates have had on banks and homebuilders. Next, we recap today’s brutal 3 year note auction before finishing with Census data on national rental vacancy rates.
See today’s post-market Closer and everything else Bespoke publishes by starting a 14-day free trial to Bespoke Institutional today!
Daily Sector Snapshot — 3/10/20
Buckle Up for the Close
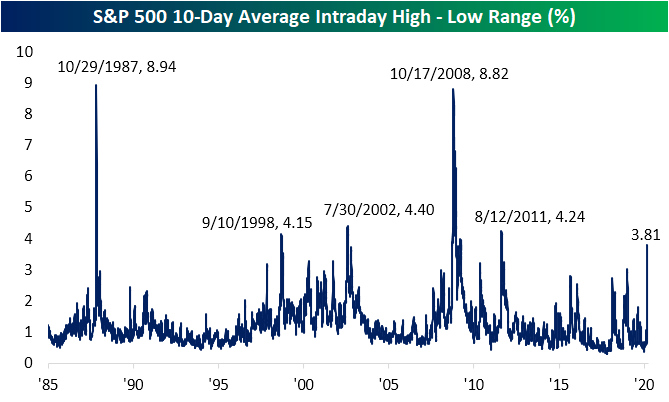
In the past 48 hours, we have witnessed futures reach both their limit up and down as well as a 15-minute freeze on trading yesterday when the S&P 500 fell 7%. If that is any indication, equities have been remarkably volatile. As shown in the chart below, over the past ten trading days the S&P 500 has averaged a 3.81% difference between the intraday high and intraday low. That is the highest reading since 2011 and since 1985 there have only been a few other periods of higher readings; the highest of which occurred in October of 1987 and 2008.
Delving deeper into the intraday patterns, the last hour, in particular, has been very volatile. Just from three o’clock to the close at four o’clock, the S&P 500 has moved up or down 1.1% on average over the past ten days. Again you would have to go back to 2011 to find this type of late-day volatility. Prior to that, only the financial crisis, 2002, 1997, and 1987 saw similar instances.

If the final hour of trading is too long of a time horizon for you, then try the final 15 minutes. Going back to 1985, there has only been one other 10-day period with a more volatile finish to the day: October of 2008. Back then, the final 15 minutes of trading averaged a 1.7% move; more than double the current volatility. The only other comparable period is back in October of 1987 when the last 15 minutes averaged a slightly smaller move of 0.83%. For comparison, from the start of the year to the S&P 500’s high on 2/19, the average absolute full-day change for the S&P 500 was even less than this at 0.57%. Start a two-week free trial to Bespoke Institutional to access our full range of research and interactive tools.
