Chart of the Day: Historically Weak Financials
Sentiment Snoozefest
Weekly results from AAII’s investor sentiment survey was uneventful this week. All of the readings across bullish, bearish, and neutral sentiment saw a move of less than one percentage point. That is the first time this has happened since June 27th of last year and other than those two occurrences, it has only happened 15 other times throughout the survey’s history. Bullish sentiment held firm above 30%, rising 0.35 percentage points to 30.39%. That was bullish sentiment’s third consecutive week moving higher.

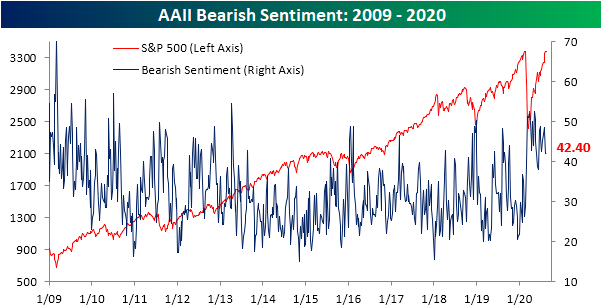
Bearish sentiment remains the predominant sentiment reported by investors as it rose slightly from 41.12% to 42.4% this week. In absolute terms, that is the smallest weekly change for bearish sentiment since a 0.03 percentage point move on March 19th.
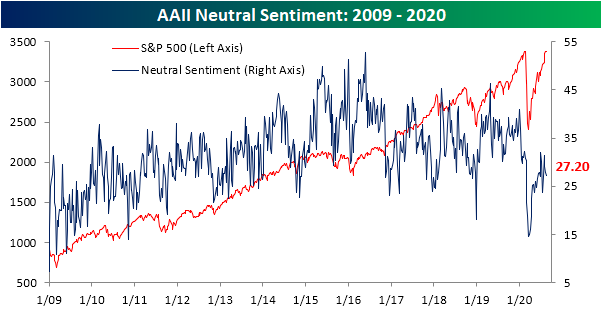
Those small gains to bullish and bearish sentiment took from neutral sentiment which fell 0.64 percentage points to 27.2%. Of the three readings, this was the largest move this week.
With bearish sentiment still outweighing bulls, the bull-bear spread remains negative as it has for a record streak of 26 weeks. Like what you see? Start a two-week free trial to Bespoke Institutional for full access to all of our research and interactive tools.

Jobless Claims Back Above 1 Million
Last week, initial jobless claims came in below one million for the first time in 21 weeks. Even though another sub-million print was expected, claims actually saw a dramatic increase rising to 1.106 million. The 135K increase week over week was the biggest single-week increase of the pandemic excluding the first two enormous jumps in the second half of March; both of which were increases of over 3 million. Even though that is a big jump from last week, the actual level of claims remains around some of the lowest levels since the pandemic began. In fact, despite the large increase this week, claims are still lower than they were two weeks ago.

On a non-seasonally, adjusted basis claims were 891.5K this week. That actually marks a third straight week with claims below a million as the level of this reading continues to offer a bit more of an optimistic view than the seasonally adjusted number. Although NSA claims remain around the lowest levels of the pandemic, there was not an improvement this week. The 52.8K increase week over week was the first rise in four weeks and was the third-largest increase since the first week of April.

As we have noted recently, the summer months through September have seasonally been a strong time for claims as the nonseasonally adjusted (NSA) number has tended to drift lower. The increase this week is out of the ordinary for this point in the year as it was the first time in the history of the data (since 1967) that NSA claims for the current week of the year (33rd week) were higher from the prior week. In other words, the rise in claims this week bucked a historically consistent trend of seasonal strength.

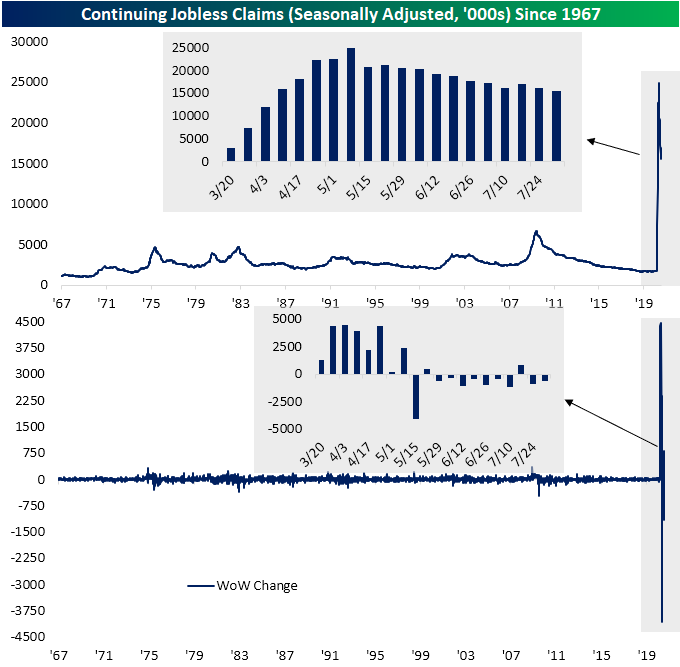
The big drop in claims last week benefitted the most recent reading for continuing claims (lagged an additional week to initial claims) which have continued to decline as they broke below 16 million for the first time since April 10th. The 604K WoW decline was slightly smaller than last week’s 861K decline
For Pandemic Unemployment Assistance (PUA), initial claims were also higher, rising over 50K from last week. In total, claims (the headline number plus PUA claims) rose to 1.43 million from 1.33 million last week. Again while that is an increase from last week’s lows, it is still around some of the strongest levels of the pandemic. Total NSA continuing claims for the last week of July (continuing PUA claims are lagged another additional week), on the other hand, fell slightly from 26.6 million to 26.4 million. That was entirely thanks to a drop in regular claims as PUA claims actually rose from 10.7 million to 11.2 million. Start a two-week free trial to Bespoke Institutional to access our interactive economic indicators monitor and much more.

Bespoke’s Morning Lineup – 8/20/20 – Split Almost Right Down the Middle
See what’s driving market performance around the world in today’s Morning Lineup. Bespoke’s Morning Lineup is the best way to start your trading day. Read it now by starting a two-week free trial to Bespoke Premium. CLICK HERE to learn more and start your free trial.
“Waiting helps you as an investor and a lot of people just can’t stand to wait.” – Charlie Munger
Heading into the 8:30 data, we were looking at the possibility of the first back to back sub-million readings in jobless claims and the first reading below 15 million in continuing claims since April. Well, you can’t win them all. While continuing claims fell below 15 million to 14.844 million, initial claims surged to 1.106 million for the largest weekly increase since March.
Be sure to check out today’s Morning Lineup for a rundown of the latest stock-specific news of note, market performance in the US and Europe, trends related to the COVID-19 outbreak, and much more.

We hear a lot about how top-heavy the market has become and how uneven performance has been, especially since the COVID crisis began. Looking at performance on a group basis, though, doesn’t quite confirm that narrative. After Wednesday’s modest losses, the S&P 500 is down slightly relative to its 2/19 pre-COVID high. Of the 24 S&P 500 industry groups, eleven have outperformed the S&P 500 since 2/19 while thirteen have underperformed. That’s almost an even split right down the middle and exactly what you would expect to see for a stock market that is essentially unchanged over that span.
Leading the way to the upside, two groups stand out among the rest, and they are Retailing and Tech Hardware which have both rallied over 25%. This is where the top-heaviness of the market comes into play as Retailing is primarily Amazon (AMZN) while Tech Hardware might as well be Apple (AAPL). To the downside, though, two groups also standout against all the others. With declines of over 30% since 2/19, both Banks and Energy are lagging every other industry group by at least ten percentage points.

Daily Sector Snapshot — 8/19/20
B.I.G. Tips – Earnings Season and Top Triple Plays
Walmart (WMT) wrapped up the Q2 2020 earnings reporting period on Tuesday with a huge beat on both the top and bottom line. It was a fitting end to what turned out to be a record-setting earnings season.
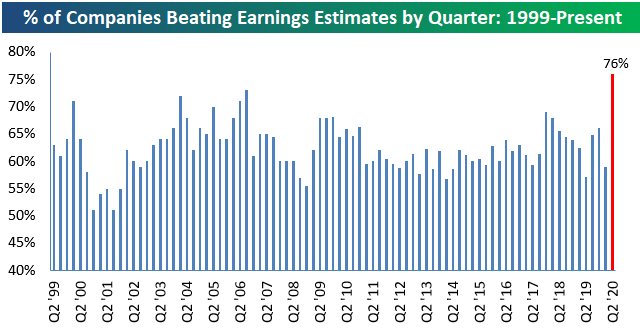
As we highlighted in our Q2 Earnings Season preview in early July, analysts were rapidly increasing earnings estimates leading up to earnings season. Normally when that happens, stocks have trouble performing well during earnings season because the expectations bar has been set higher. This season, even with analyst estimates on the rise in the four weeks leading up to the start of the reporting period, companies managed to beat bottom-line EPS estimates at the highest rate in the history of our database going back to 1999.
As shown below, 76% of companies reported stronger-than-expected EPS numbers this season, which eclipsed the prior record high of 73% seen during the Q3 2006 reporting period.
Long-term Bespoke subscribers know how much we like earnings triple plays, but for those that haven’t heard of the term, we came up with it back in the mid-2000s. An earnings triple play is a company that beats EPS estimates, beats revenue estimates, and raises forward guidance all in the same quarterly earnings report. Investopedia.com is one of the best online resources for financial markets education, and they’ve actually given us credit for coining the “triple play” term on their website. We consider triple play stocks to be the cream of the crop of earnings season, and we are constantly finding new long-term buy opportunities from this basket of names each quarter.
This earnings season there were a massive number of earnings triple plays. We went through the list of this season’s triple plays to find the ones that have the most attractive set-ups heading into the earnings off-season. Today we have identified 37 stocks that made the cut. To see these names, simply start a two-week free trial to Bespoke Premium today. Upon sign-up, you’ll unlock our Top Triple Plays report!
Industry Group Breadth Positive
While the S&P 500 moved to a new all-time high on a closing basis Tuesday, we wanted to check in on breadth with respect to S&P 500 industry groups and how they’re trading relative to their 50 and 200-day moving averages. While we hear a lot about the largest five stocks in the S&P 500 accounting for the lion’s share of the gains, it’s not as if everything else in the market is falling apart.
Looking first at S&P 500 industry groups versus their 200-day moving averages (DMA), while not extraordinary by any means, more than two-thirds are currently above their 200-DMAs, and the level continues to trend higher. A more worrying sign would have been if this reading was much higher and showing signs of rolling over. The seven industry groups that are currently below their 200-DMAs are Banks, Consumer Services, Energy, Insurance, Real Estate, Telecom Services, and Utilities.

On a shorter-term basis, the percentage of industry groups currently above their 50-DMAs is considerably higher at over 95%. In other words, the only industry group not above its 50-DMA is Energy. What else is new? Now that the S&P 500 has taken out its February highs, these breadth readings will be key indicators to watch for signs of participation (or lack thereof) in any rally. Click here to view Bespoke’s premium membership options for our best research available.

Chart of the Day: All Time Highs on Bad Breadth
Fixed Income Weekly – 8/19/20
Searching for ways to better understand the fixed income space or looking for actionable ideas in this asset class? Bespoke’s Fixed Income Weekly provides an update on rates and credit every Wednesday. We start off with a fresh piece of analysis driven by what’s in the headlines or driving the market in a given week. We then provide charts of how US Treasury futures and rates are trading, before moving on to a summary of recent fixed income ETF performance, short-term interest rates including money market funds, and a trade idea. We summarize changes and recent developments for a variety of yield curves (UST, bund, Eurodollar, US breakeven inflation and Bespoke’s Global Yield Curve) before finishing with a review of recent UST yield curve changes, spread changes for major credit products and international bonds, and 1 year return profiles for a cross section of the fixed income world.
In this week’s report we review the implications of the euro’s large rally in recent weeks.

Our Fixed Income Weekly helps investors stay on top of fixed income markets and gain new perspective on the developments in interest rates. You can sign up for a Bespoke research trial below to see this week’s report and everything else Bespoke publishes free for the next two weeks!
Click here and start a 14-day free trial to Bespoke Institutional to see our newest Fixed Income Weekly now!