State COVID vs. Unemployment
There have been plenty of jabs thrown between state governors since COVID began back in late February. While COVID is still ongoing, we can compare state performance numbers at this point by looking at COVID deaths per 100,000 along with state unemployment rates.
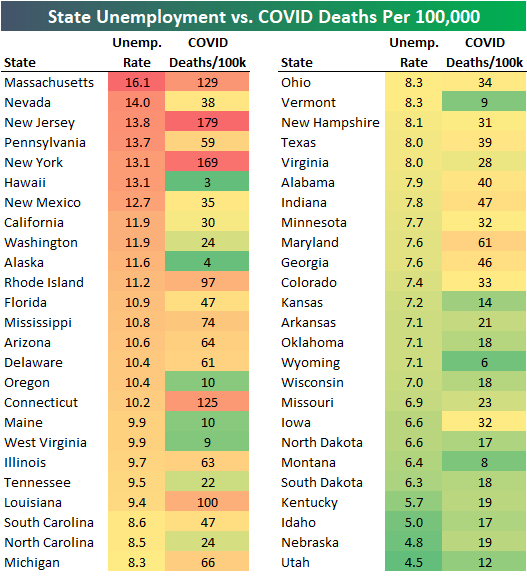
In the table below we show state unemployment rates as of July 2020 along with COVID deaths per 100,000 people (as of 8/21/20). As shown, Massachusetts currently has the highest unemployment rate at 16.1%, followed by Nevada at 14%, New Jersey at 13.8%, Pennsylvania at 13.7%, and New York and Hawaii at 13.1%.
Massachusetts, New Jersey, and New York have some of the highest unemployment rates and by far the highest COVID deaths per 100,000, but Nevada, Pennsylvania, and Hawaii have high unemployment rates yet much lower COVID deaths per 100,000. While New York and Hawaii have the exact same unemployment rates, New York has 169 COVID deaths per 100,000 while Hawaii is at just 3 deaths per 100,000.
States with the lowest unemployment rates have some of the lowest COVID deaths per 100,000.
If we provide a scatter plot of the data in the table above, you can see a pretty clear trend line between state unemployment rates and COVID deaths per 100,000:

Because of the nature of the virus, it’s obvious that states with higher population densities are more at risk. New Jersey has the highest population density in the country, and it’s also the state with the highest number of COVID deaths per 100,000. Rhode Island, Massachusetts, and Connecticut are the next most populated states in terms of people per square mile, and these states all have high COVID deaths per 100,000 as well. States like Florida, Ohio, and California have managed to keep their COVID deaths per 100,000 under much better control so far even with pretty high population density. Click here to view Bespoke’s premium membership options for our best research available.

Largest S&P 500 Stocks + Tesla (TSLA)
Tesla (TSLA) is now up 50% over the last 10 calendar days dating back to August 11th. This has propelled the company way up the list of the largest US companies.
Below is a table of the largest stocks in the S&P 500 with Tesla (TSLA) included. As shown, Tesla’s $382.7 billion market cap would rank it as the 9th largest stock in the S&P 500 were it in the index.
On August 11th, Tesla’s market cap was just $256 billion, so over the last ten days it has leapfrogged companies like Walmart (WMT), Home Depot (HD), JP Morgan (JPM), Procter & Gamble (PG), Mastercard (MA), and NVIDIA (NVDA). Next up would be Visa (V) and Johnson & Johnson (JNJ), which have market caps just under $400 billion. Click here to view Bespoke’s premium membership options for our best research available.

Bespoke’s Morning Lineup – 8/21/20 – One Down, One to Go
See what’s driving market performance around the world in today’s Morning Lineup. Bespoke’s Morning Lineup is the best way to start your trading day. Read it now by starting a two-week free trial to Bespoke Premium. CLICK HERE to learn more and start your free trial.
“An investment in knowledge pays the best interest.” – Benjamin Franklin
The Democrats have had their turn, and now the attention will turn to the Republican Party next week. After that, the race starts! Whether it was the fact that the convention was confined to the virtual world or something else, the typical bounce that a ticket sees during their convention hasn’t materialized this year. In the last week, Biden’s odds for winning the election in November have actually declined a bit, while the odds of the Democratic party taking control of the Senate have seen a larger drop, falling from 61.2% down to 56.3%. The lack of a bounce is good news for Republicans, but with their convention also taking on a more subdued tone next week, there’s no guarantee that the Trump ticket will see a bounce either.
In markets this morning, futures have been dropping all morning and aren’t far from their lows of the day. While Asia was positive overnight, European equities started the day modestly lower and have been weakening all morning. Weak economic data in Europe and trade issues with China are all weighing on sentiment.
Be sure to check out today’s Morning Lineup for a rundown of the latest stock-specific news of note, market performance in the US and Europe, updated flash PMI readings for August, trends related to the COVID-19 outbreak, and much more.

For a month that usually isn’t great for the market, this August has been shaping up just fine. Through Thursday’s close, the S&P 500 was up 3.5% so far in August. For the first 20 days of August, this month has been the strongest since the 4.26% gain in 2000, and going back to 1945 there have only been eleven other August months that saw a stronger performance in the first 20 days of the month.

B.I.G. Tips – Death by Amazon – 8/20/20
Amazon (AMZN) is up to 5.7% of the S&P 500’s market cap. While other large tech-adjacent names have had a similarly large impact on the aggregate market this year, the e-commerce giant remains somewhat unique for its scale and penetration into every possible market. At the same time, it’s interesting to note that many other retailers have been able to thrive in this environment. Target (TGT), Wal-Mart (WMT), Home Depot (HD), and Lowe’s (LOW) are all examples of retailers that have leveraged a combination of unique offerings and extremely rapid digital sales growth. 100% YoY sales growth for digital channels is the norm for many major retailers at this point. Unfortunately, while some companies have been able to thrive in the current environment, smaller and more specialized retailers haven’t been able to drive traffic as well. Two recent de-listings removed from our index this month (ASNAQ and TLRDQ) are examples of stocks that haven’t been able to keep up.
Our “Death By Amazon” index was created many years ago to provide investors with a list of retailers we view as vulnerable to competition from e-commerce. In 2016, we also created our “Amazon Survivors” index which is made up of companies that look more capable of dealing with the threat from online shopping. To see how the two indices have been performing lately and view the full list of stocks that make up the indices, please read our newest report on the subject available to Bespoke Premium and Bespoke Institutional members.
To unlock our “Death By Amazon” and “Amazon Survivors” indices, login or start a two-week free trial to either Bespoke Premium or Bespoke Institutional.

Bespoke’s Weekly Sector Snapshot — 8/20/20
Philly Fed in a Funk
On the back on Monday’s weaker Empire Fed survey, today’s release of the Philadelphia Fed’s Business Outlook Survey similarly showed a slowdown in activity during August. The headline index fell 7 points to 17.2. While that is a third consecutive expansionary reading, it also marked back to back declines. That means that the region’s manufacturing sector has continued to grow, but at a decelerating pace in the past two months.

Like the headline number, many of the individual categories also remain in expansion territory but were lower than last month. The only readings to rise month over month were the indices for Delivery Times, Inventories, and Prices Received. Inventories as well as the index for Unfilled Orders were the only ones to be in contraction in August.
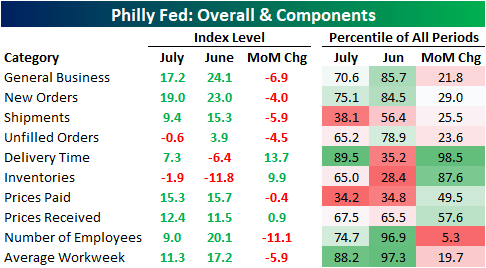
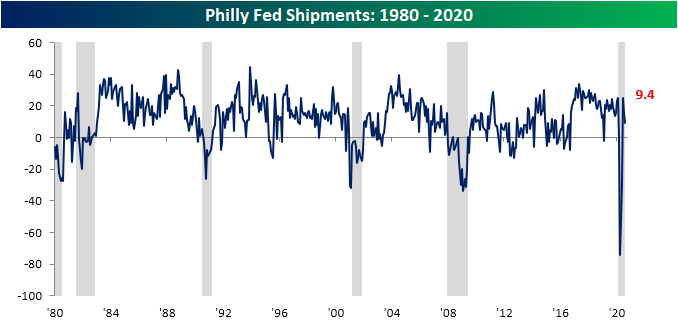
Demand continues to improve with both the indices for New Orders and Shipments showing another expansionary reading in August, but both were also lower indicating demand did slow somewhat. While the index for New Orders remains at a healthy level historically, in the upper quartile of all readings since 1980, Shipments are at a more muted level in just the 38th percentile.

As for employment metrics, there was a slowing in the Number of Employees hired in the region with that index falling from 20.1 to 9. That 11.1 drop was the biggest change of any sub-index this month and with respect to that index, this month’s decline was in the bottom 5% of all monthly changes. Not only did the index for Number of Employees fall, but so did the index for Average Workweek, although it still remains in the upper end of its historical range. Start a two-week free trial to Bespoke Institutional to access our interactive economic indicators monitor and much more.

The Bespoke 50 Top Growth Stocks — 8/20/20
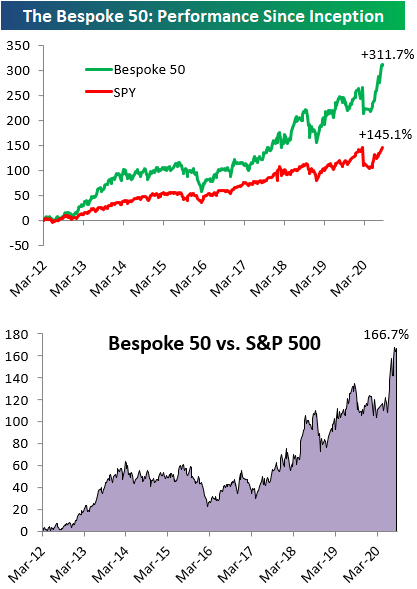
Every Thursday, Bespoke publishes its “Bespoke 50” list of top growth stocks in the Russell 3,000. Our “Bespoke 50” portfolio is made up of the 50 stocks that fit a proprietary growth screen that we created a number of years ago. Since inception in early 2012, the “Bespoke 50” has beaten the S&P 500 by 166.7 percentage points, which hit a new high this week. Through today, the “Bespoke 50” is up 311.7% since inception versus the S&P 500’s gain of 145.1%. Always remember, though, that past performance is no guarantee of future returns. To view our “Bespoke 50” list of top growth stocks, please start a two-week free trial to either Bespoke Premium or Bespoke Institutional.
Leading Indicators Up Again
The Conference Board’s Index of Leading Indicators for July came in stronger than expected, rising 1.4% compared to expectations for a gain of 1.1%. From its high of 112.0 in January to its low in April, leading indicators saw the largest three-month decline in the history of the index. Since then, we’ve now seen the largest three-month increase on record. Unfortunately, the magnitude of the increase hasn’t been nearly as strong as the decline, but it’s an improvement nonetheless.
This month’s stronger than expected increase in leading indicators was also notable for what it suggests about the business cycle. As shown in the chart, the bounce of the last three months has now erased nearly half of the decline from January through April, but more importantly, the only other times the index has risen three times in a row during a recession was in the last three months of the 1981/1982 contraction from September through November and the last three months of the Financial Crisis from April to June 2009. If past history is any guide, that would suggest that the COVID-recession ended in July or earlier.

Looking at the ratio of leading to coincident indicators shows an even stronger picture. As we have mentioned numerous times in the past, this ratio always starts to roll over in advance of a recession. Interestingly enough, leading up to the most recent recession, this ratio started drifting lower beginning in late 2018, although not anywhere close to the typical weakness you would see heading into prior recessions. In other words, the economy was already on a relatively shaky footing in advance of COVID.
In the last three months, though, the ratio has seen a large rebound nearly erasing all of its declines from the last peak. At 22 months now since the last peak, the current streak has been a lengthy one, but looking just at the period since the end of the Financial Crisis, the current streak isn’t even the longest. That title belongs to the 27-month drought from mid-2011 through late 2013. Like what you see? Start a two-week free trial to Bespoke Institutional for full access to all of our research and interactive tools.

Chart of the Day: Historically Weak Financials
Sentiment Snoozefest
Weekly results from AAII’s investor sentiment survey was uneventful this week. All of the readings across bullish, bearish, and neutral sentiment saw a move of less than one percentage point. That is the first time this has happened since June 27th of last year and other than those two occurrences, it has only happened 15 other times throughout the survey’s history. Bullish sentiment held firm above 30%, rising 0.35 percentage points to 30.39%. That was bullish sentiment’s third consecutive week moving higher.

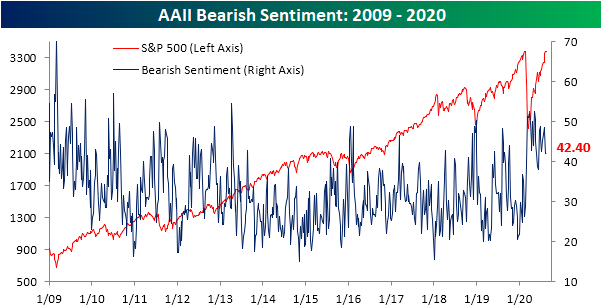
Bearish sentiment remains the predominant sentiment reported by investors as it rose slightly from 41.12% to 42.4% this week. In absolute terms, that is the smallest weekly change for bearish sentiment since a 0.03 percentage point move on March 19th.
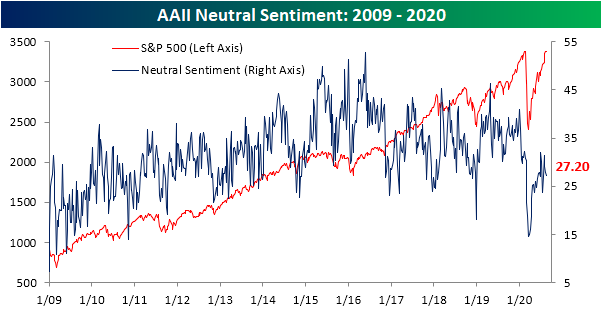
Those small gains to bullish and bearish sentiment took from neutral sentiment which fell 0.64 percentage points to 27.2%. Of the three readings, this was the largest move this week.
With bearish sentiment still outweighing bulls, the bull-bear spread remains negative as it has for a record streak of 26 weeks. Like what you see? Start a two-week free trial to Bespoke Institutional for full access to all of our research and interactive tools.
