Bespoke’s Morning Lineup – 8/28/20 – And They’re Off
See what’s driving market performance around the world in today’s Morning Lineup. Bespoke’s Morning Lineup is the best way to start your trading day. Read it now by starting a two-week free trial to Bespoke Premium. CLICK HERE to learn more and start your free trial.
“If I had asked the public what they wanted, they would have said a faster horse.“ – Henry Ford
The conventions for both parties are done, and the race is officially on as President Trump and former Vice President Biden will take the next two months to make their case to the American people. What was looking like a runaway for Biden just a few weeks ago has become a bit closer. Biden still has the lead over Trump, but the gap has narrowed by close to two-thirds from its widest levels in July. It’s natural for candidates to see a bounce after their conventions, and this week alone Trump has seen his contract to win the election increase by three percentage points. We’ll know soon enough if that bounce was a sugar rush or something more lasting.

In other news this morning, futures are higher again as the S&P 500 looks to make it seven straight positive days in a row. In order to get there, though, the market will have to get through a busy slate of economic data with Personal Income (better than expected), Personal Spending (better than expected), Wholesale Inventories (better than expected), Chicago PMI, and Michigan Confidence all coming out between now and 10 AM. The dollar is also weaker today and gold is rallying following news that Japanese PM Abe will step down at the end of his term and that has the yen rallying.
Be sure to check out today’s Morning Lineup for a rundown of the latest stock-specific news of note, market performance in the US and Europe, trends related to the COVID-19 outbreak, and much more.

With the market at record highs, there are a number of conflicting signals concerning investor sentiment. While the AAII sentiment survey routinely shows negative sentiment, and the latest Consumer Confidence report showed a lack of enthusiasm for equities, other sentiment surveys like Investors Intelligence or put/call ratios show a more optimistic backdrop. Another indicator of sentiment showing optimism on the part of investors is the National Association of Active Investment Managers (NAAIM) Exposure Index Index.
The NAAIM Exposure Index tracks the exposure of its members to US equity markets. Each week members are asked to provide a number that represents their exposure to markets. A reading of -200 means they are leveraged short, -100 indicates fully short, 0 is neutral, 100% is fully invested, and 200% indicates leveraged long. This week’s reading of 106.56 indicates one of the highest readings in the history of the index.

The Bespoke 50 Top Growth Stocks — 8/27/20
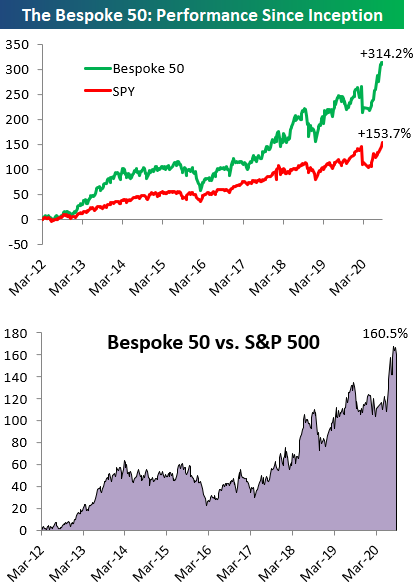
Every Thursday, Bespoke publishes its “Bespoke 50” list of top growth stocks in the Russell 3,000. Our “Bespoke 50” portfolio is made up of the 50 stocks that fit a proprietary growth screen that we created a number of years ago. Since inception in early 2012, the “Bespoke 50” has beaten the S&P 500 by 160.5 percentage points, which hit a new high this week. Through today, the “Bespoke 50” is up 314.2% since inception versus the S&P 500’s gain of 153.7%. Always remember, though, that past performance is no guarantee of future returns. To view our “Bespoke 50” list of top growth stocks, please start a two-week free trial to either Bespoke Premium or Bespoke Institutional.
Bespoke’s Weekly Sector Snapshot — 8/27/20
S&P 500 Stocks: Worlds Apart
If you’ve been paying attention this year, you know that the S&P 500 has been carried by the performance of the index’s largest components, and the chart below illustrates just how wide the disparity has been. It shows the YTD performance of each of the S&P 500’s members sorted by their market cap heading into 2020 with the largest stocks on the left side and the smallest stocks on the right. So far this year, the 50 largest stocks in the S&P 500 are up an average of 11.3% YTD, and if we were to take an even narrower look at just the ten largest stocks heading into the year, the average YTD gain is over 27%!
While the largest stocks are up a lot this year, the next 400 stocks in terms of market cap haven’t fared nearly as well, averaging a decline of 2.0%. That’s not great, but considering the pandemic this year, even a 2% decline isn’t such a bad thing. The same can’t be said for the smallest stocks in the S&P, however. As shown below, the 50 smallest stocks are down an average of 15.3% YTD, and more than two-thirds of them are down!
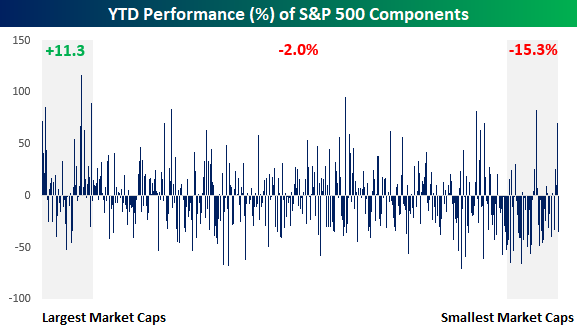
Another way to illustrate the declining fortunes of stocks this year based on their size is by looking at a moving average of YTD stock performance across the market cap spectrum, In the chart below, the first point on the chart represents the performance of the 50 largest stocks in the S&P 500 which have gained an average of 11.3% YTD. The next point to the right represents the average YTD change of the stocks that ranked between number 2 and 51 in terms of market cap at the start of 2020, and we continue that process down the entire list of components to the point where the last point in the series on the right side of the chart represents the average performance of the 50 smallest stocks in the S&P 500 heading into the year. As mentioned above, that group of stocks has averaged a decline of 15.3% YTD. The performance of the 50 largest stocks in the S&P 500 ranks as the fourth-best of 451 different points on the chart, while the basket of the 50 smallest stocks ranks as the 29th worst performing basket. In 2020, the bigger the stock, the better the returns. Click here to view Bespoke’s premium membership options for our best research available.

Chart of the Day: Calling All Calls
Claims Still Hovering Around 1 Million
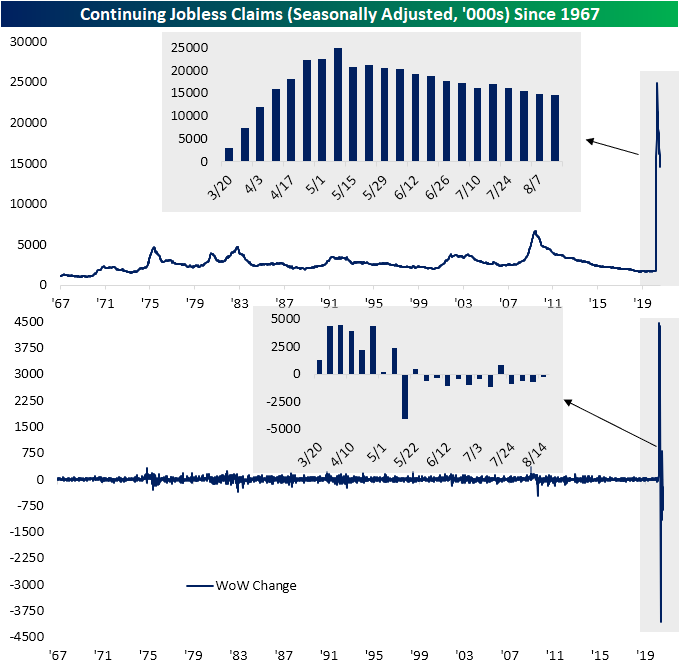
Seasonally adjusted jobless claims continue to hover right around 1 million as forecasts were predicting. This week’s reading of 1.006 million was down 98K from 1.104 million last week and remains around some of the lowest levels of the pandemic. But as we have frequently mentioned, that is still very elevated relative to the rest of history.

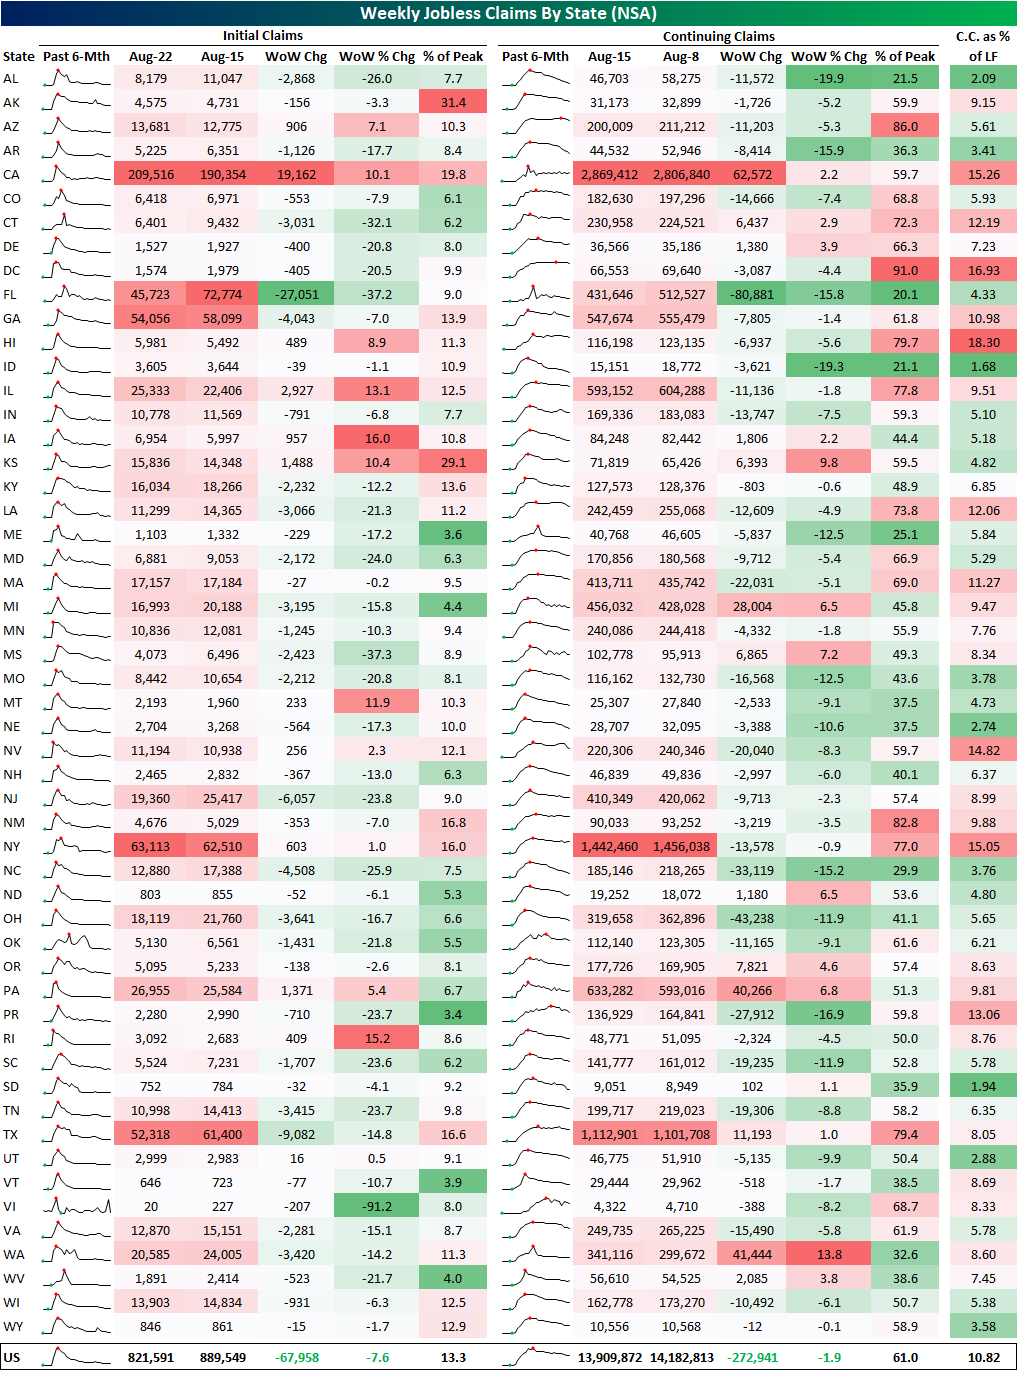
On a non-seasonally adjusted basis, claims have likewise continued to fall as is the seasonal norm for this time of year. NSA jobless claims came in at a pandemic low of 821.59K this week, down from 889.55K last week. Again, although NSA claims have been lower, there are seasonal headwinds. Headed into the fall, claims tend to experience a seasonal bottom by mid-September, so NSA claims could begin to tick higher in the coming weeks.

As for seasonally adjusted continuing claims, there was also a small improvement falling from 14.76 million to 14.54 million. That is a fourth consecutive week in which continuing claims have declined.
Factoring in Pandemic Unemployment Assistance (PUA), total NSA claims actually rose. Initial PUA claims rose from 0.53 million to 0.61 million for the second straight weekly increase. As for continuing claims (non-seasonally adjusted and lagged an additional week), total claims continued to fall in the first week of August reaching 25.2 million. That’s around the same levels as late April, but unlike back then, a much larger share of those claims are comprised of PUA claims.

Finally, in the table below we show a breakdown of initial and continuing claims (both NSA) by state. As depicted, California, Illinois, Iowa, Kansas, and Montana all saw the largest percentage increases in initial claims this week, but not all of those are that elevated relative to where they have been in recent months. Kansas and Alaska are reporting claims that are the least improved from their pandemic peak. Additionally, the bulk of states have reported an improvement this week. Of the 53 states and territories, 41 reported lower claims this week. While not quite as strong, the same can be said for continuing claims. 39 states reported a decline in continuing claims while 14 reported an increase. Based on continuing claims, California, DC, Hawaii, Nevada, and New York currently have the highest unemployment rates each in the teens (continuing claims as a percent of the state’s labor force). Click here to view Bespoke’s premium membership options for our best research available.
Bullish Sentiment Slowly But Surely Rising
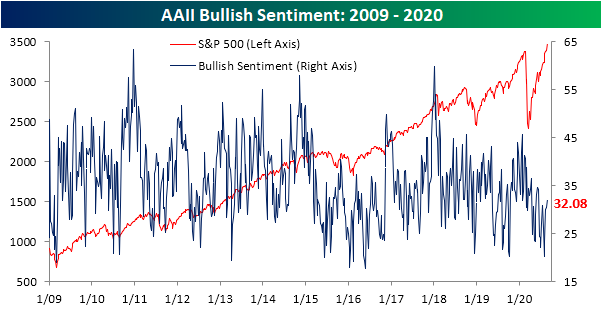
Additional all-time highs this week helped to further boost sentiment as the percentage of investors reporting as bullish in AAII‘s weekly sentiment survey rose to 32.08% from 30.39% last week. That is the highest level of bullish sentiment since mid-June when it spent two weeks above 34%. Think about that for a minute. While the S&P 500 makes new record highs, still less than a third of these investors consider themselves bullish.
The gain in optimism took share from the bear camp as the percentage of bearish investors fell 2.78 percentage points to 39.62%. Although it remains the predominant sentiment reading, that is the lowest level since June 11th’s 38.05% reading. This week in addition to that June 11th reading and the prior week to that (June 4th) marks just the third time since the bear market low that bearish sentiment was below 40%. Before those June readings below 40%, you would need to go back to the first week of March to find the last time bearish sentiment was below 40%.

Given the opposing moves in bullish and bearish readings, the bull-bear spread is still negative as the record streak of negative readings grows to 27 weeks long. The spread is now the closest it has been to zero since June 11th.

Not all of the losses to bearish sentiment went to the bulls. Neutral sentiment is still in the same range it has been in all of August, rising to 28.3% this week. Click here to view Bespoke’s premium membership options for our best research available.

Bespoke’s Morning Lineup – 8/27/20 – Flirting With Greatness
See what’s driving market performance around the world in today’s Morning Lineup. Bespoke’s Morning Lineup is the best way to start your trading day. Read it now by starting a two-week free trial to Bespoke Premium. CLICK HERE to learn more and start your free trial.
“The most important quality for an investor is temperament, not intellect. You need a temperament that neither derives great pleasure from being with the crowd or against the crowd.” – Warren Buffett
Besides the Powell speech coming up in a half-hour, we have a bunch of economic data to contend with this morning. Revised GDP for Q2 showed a modestly lower decline than expected (-31.7% vs -32.5%). Initial jobless claims were essentially right in line with forecasts, although continuing claims were higher than expected.
Be sure to check out today’s Morning Lineup for a rundown of the latest stock-specific news of note, market performance in the US and Europe, economic data out of Europe and Asia, trends related to the COVID-19 outbreak, and much more.
August is on pace to be a month unlike any other for the S&P 500 over at least the last 25 years. Through Wednesday’s close, the S&P 500 tracking ETF (SPY) was up 6.4% month to date. Even more impressive than the gain, though, has been the consistency of the rally. So far this month, SPY has only finished the day lower three times in eighteen trading days. That’s an 83% win rate!
How does that stack up to history? The chart below shows SPY’s percentage of up days by month dating back to its inception in 1993. Not only has there never been a month with a higher percentage of up days, but there have only been six others where the percentage of up days even touched 75%. There are still three trading days left in August, but even if all three days finish lower, SPY will have finished higher on more than 70% of all trading days this month. Rallies like the one we have seen in August are obviously great if you are long equities, but enjoy them while they last because they won’t last forever.

Daily Sector Snapshot — 8/26/20
COVID Concerns and Case Counts
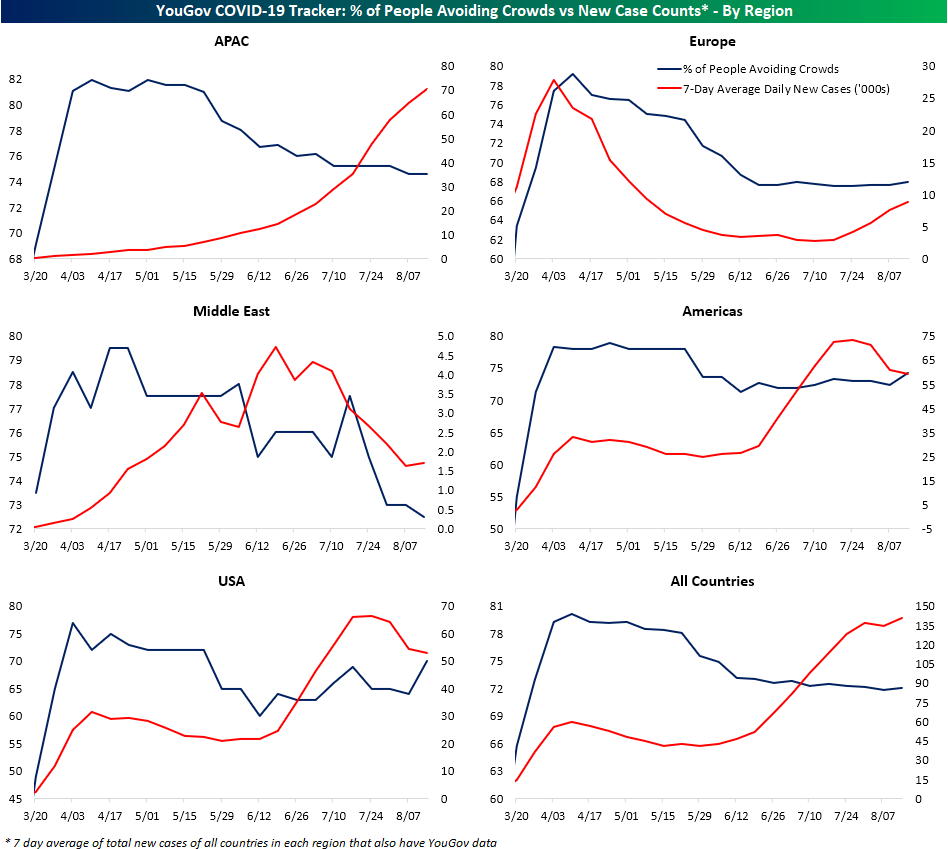
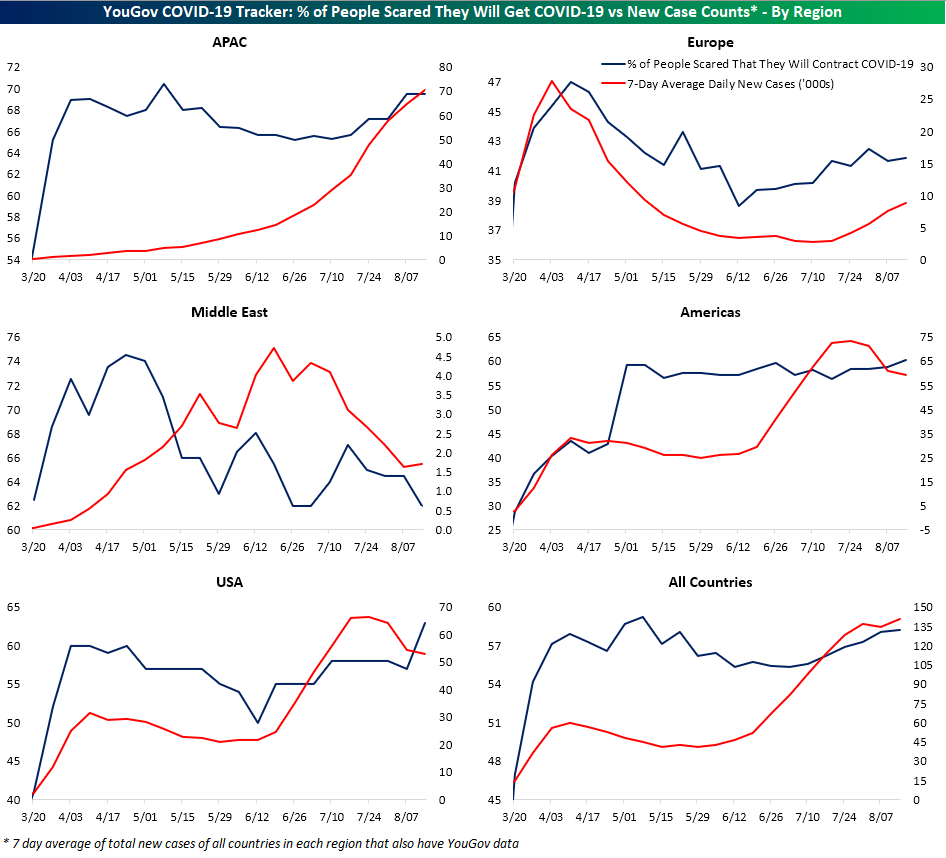
In Monday’s Closer, we took a look at data from YouGov’s COVID-19 Public Monitor which surveys people from countries around the globe on various COVID related topics such as if they were worried about contracting COVID-19, do they wear a mask when out in public, and do they avoid crowds.
In the charts below, we show the average readings of these survey results (blue line, left axis) across the countries of each region that have data available compared to the seven day average of total new case counts for those same countries in each region (red line, right axis). Broadly speaking and as could be intuitively expected, as case counts rise, higher shares of people report being more concerned about contracting the virus. European countries (Denmark, Finland, France, Germany, Italy, Norway, Spain, Sweden, and the UK) perhaps show this relationship the most cleanly as cases fell through the spring alongside concerns of contraction, but from June through the most recent readings earlier this month, concerns and case counts have steadily risen. Since July, APAC countries (Australia, China, Hong Kong, India, Indonesia, Japan, Malaysia, Philippines, Singapore, Taiwan, Thailand, and Vietnam) have similarly seen worries over catching COVID climb as the averages for daily new cases for those countries have also risen. Granted, worries were on the decline up through July despite rising cases. Meanwhile, US worries about catching the virus were at their highest levels yet as of early August, and that is even though case counts have been on the decline since the second half of July.
Fortunately, Americans seem to be proactive. As shown below, as those concerns have risen, a higher share of Americans have reported that they wear a mask when they go out in public. That potentially could be one of many factors in the recent decline in case counts. Granted, there has been a growing trend around the globe of more people wearing face masks, and that inverse relationship between masks and new cases is not necessarily shared in regions like Europe. As shown in the top-right chart, despite a record number of Europeans who say they wear a mask in public, COVID cases are back on the rise.

As for another spread mitigation measure, avoiding crowds, the same can be said for the US. As case counts have declined more people have been avoiding crowds. In Asia and Europe, though, fewer people have been avoiding crowds compared to earlier in the pandemic which may help to explain why case counts are rising. Click here to view Bespoke’s premium membership options for our best research available.