Housing Still Hot Headed Out of Summer
This morning, the Mortgage Bankers Association (MBA) released this week’s reading on mortgage applications. Seasonally adjusted purchases were up 2.6% from last week, rising to the highest level since the first week of July. In the past few months as housing activity has surged, other than that July reading, there was only one other time that purchases were stronger, and that was in the second week of June. In other words, purchase activity is once again on the rise after taking a bit of a breather in the summer months and is currently back to some of its strongest levels since early 2009. With rates staying low, refi activity similarly remains around some of its stronger levels of the past decade gaining nearly 3% this week. Granted, that is still in the range that the index for refinances has been in since the spring.
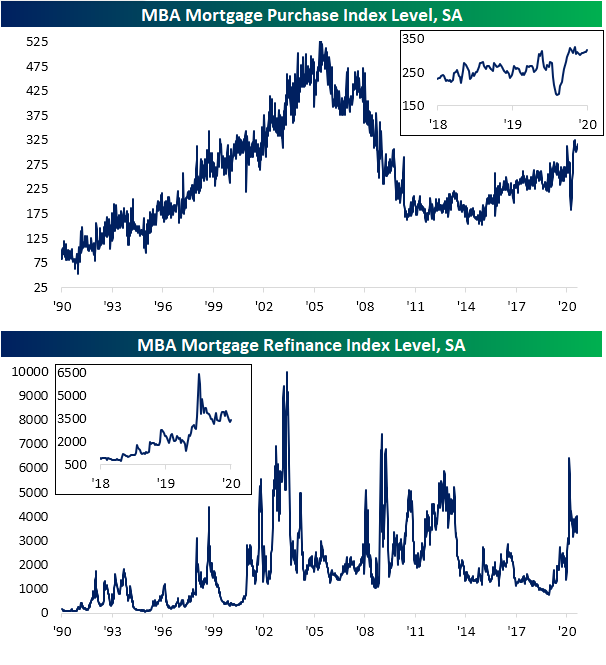
As shown in the charts below, on a non-seasonally adjusted basis, purchase applications continue to run well above trend. Even with the big decline that went against seasonal norms in the spring (first chart below), the index of YTD purchase applications has averaged 290.1 each week compared to 272.4 last year (second chart below); these are by far the strongest readings of the past decade. For every week since the mid-June 2020 peak (which was later in the year than usual due to pent up demand; denoted by the blue dot in the first chart below), purchase applications have been consistent with seasonal trends, but each week’s reading has been higher year over year by an average of over 24%. This week, thanks to the timing of the Labor Day holiday, the NSA purchase index rose by an even stronger 40% YoY which was by far the strongest reading of any week of this year.

Another housing indicator showing similarly strong demand that we touched on in last night’s Closer was the July version of Black Knight’s monthly Mortgage Monitor. Although it is at a greater lag than MBA’s readings, this was yet another data point pointing to strong housing demand as new originations in June (lagged an extra month to the rest of the report that covered the month of July) surged to over 1.3 million which was the highest reading since at least 2013; doubling year over year. The July Mortgage Monitor also indicated that delinquencies as a percentage of all loans have continued to improve, falling to 6.9% compared to its recent peak of 7.76% back in May. Albeit improved, the delinquency rate is still elevated at its highest levels since early 2013/late 2012. Click here to view Bespoke’s premium membership options for our best research available.


Bespoke CNBC Appearance (9/9)
Bespoke co-founder Paul Hickey appeared on CNBC’s Squawk Box this morning to discuss the outlook for large-cap tech stocks and the broader market. To view the segment, please click on the image below. Click here to view Bespoke’s premium membership options for the best market analysis available.

September Mean Reversion
In today’s Morning Lineup, we showed an update of our ETF Performance Matrix, which summarized the performance of key ETFs across asset classes on a YTD and MTD basis as well as since the March 23rd low. In looking through the matrix, it’s clear that much of the declines that equities have seen since the start of September have been a reversal of what we saw for equities coming off the March lows through now. As noted, the Nasdaq has been underperforming small caps this month, value has been outperforming growth across all market cap ranges, and international stocks are mostly outperforming US equities. From the March lows through the start of September, though, it was the Nasdaq, growth, and US stocks that were outperforming the small caps, value, and international stocks.
One way to illustrate this relationship is in a scatter plot below comparing the performance of each equity-related ETF in the matrix from the lows on 3/23 (y-axis) versus their performance in September through Tuesday’s close (x-axis). Looking at it this way, there is a pretty clear inverse relationship between performance over these two time periods. As another example, the top ten performing of the 50 equity related ETFs in the matrix so far this September had an average rank of 36 in their performance off the March lows. Conversely, the ten worst performing ETFs in the Matrix so far this month had an average rank of 16 in their performance of the march lows. Every dog has their day, and the ‘dogs’ of the market off the March lows have been holding up very well on a relative basis so far in September. Click here to view Bespoke’s premium membership options for the best market analysis available.

Chart of the Day: Nasdaq Falls 10% But Still Above 50-DMA
Remarkably, the Nasdaq 100 managed to fall 10%+ over the last three trading days and still close above its 50-day moving average! This data point highlights just how extended into overbought territory that the index was leading up to its recent drop. The only other times the index has seen a 3-day drop of 10%+ and still closed above its 50-DMA were on January 6th, 2000 and May 30th, 2001. Following the January 2000 occurrence, the index bounced back sharply over the next month (+21.6%), but ultimately peaked in March of that year and went on to enter an extended bear market. The May 2001 occurrence also saw a big bounce-back of 7% over the next week, but that was right in the middle of the bear market and the index rolled over by 14% over the next three months.

As shown below, the Nasdaq 100 has closed above its 50-day moving average for the last 103 trading days. There have only been nine prior streaks of 100+ days above the 50-DMA in the index’s history dating back to 1985. The 50-DMA will eventually break and the streak will come to an end, and in today’s Chart of the Day, we highlight how the Nasdaq performed in the days and weeks following the break below support at the 50-DMA. We also highlight how the index performed in the days and weeks following prior three-day drops of 10%+. If you’re wondering what history has shown following past moves that are similar to what we’ve just seen for the Nasdaq, today’s Chart of the Day is a helpful read. You can access the report with a two-week free trial to any of our three premium membership levels. CLICK HERE to start your free trial now.

Bespoke’s Morning Lineup – 9/9/20 – It’s All About Your Perspective
See what’s driving market performance around the world in today’s Morning Lineup. Bespoke’s Morning Lineup is the best way to start your trading day. Read it now by starting a two-week free trial to Bespoke Premium. CLICK HERE to learn more and start your free trial.
“We’re not retreating, we’re advancing in reverse” –Skulduggery Pleasant, Playing with Fire by Derek Landy
After three tough days for US stocks where the Nasdaq has declined 10%, it has quickly turned into a tough September for US equity markets. This morning the picture for futures looks brighter, but the move has little in the way of a catalyst behind it, so traders aren’t exactly trusting the move at this point.
On the economic front, the only US report on the calendar is the July JOLTS report, but given it’s looking back at July, it shouldn’t have too much of a market impact.
Be sure to check out today’s Morning Lineup for a rundown of the latest stock-specific news of note, an analysis of Japanese Machine Tool Orders (a positive report), market performance in the US and Europe, trends related to the COVID-19 outbreak, and much more.

Back at the end of August, we noted that a lot of equity indices and sectors were showing returns for the month of August that would normally be considered good years. September is now just five trading days old and returns this month have already in many cases been the equivalent of an entire bad month or in some cases even a bad year.
The Nasdaq 100’s 8%+ decline in just five trading days so far this September includes two trading days with gains to start the month off. To put this move in perspective, for an entire calendar year, the last time the Nasdaq 100 dropped over 8% was in 2008. Other indices covering the US equity markets have ranged from a 5% decline for the Russell 1000 to a loss of 3.12% for the Dow.
In the growth versus value matchup, value, for a change, has had the upper hand as ‘cheaper’ stocks outperform growth across all three market cap ranges.
Among individual sectors, Tech has led the way lower (-8.7%) followed by Energy, which is the only other sector down 5%.
In international markets, most countries have outperformed the US month to date so far, and Brazil has actually managed a gain of 1.7%.
One trend to note about performance so far in September is that it has essentially been the opposite of what we have seen since the March lows. In other words, the best performing ETFs from 3/23 through now have also been among the worst-performing ETFs since the start of September.

Daily Sector Snapshot — 9/8/20
Bespoke Stock Scores — 9/8/20
What’s Worrying Small Businesses?
In an earlier post, we detailed the results of the August report on small business optimism from the NFIB. Additionally, the monthly report surveys respondents on what are their biggest concerns. As shown below, Quality of Labor was unchanged as the biggest concern in August with 21% of businesses reporting as such. Cost of Labor, on the other hand, is less of a concern with only 9% reporting this as their biggest problem. Although it is in the middle of the road compared to other issues, that is elevated relative to the rest of history with that reading in the upper 5% of all readings. Behind Quality of Labor, Taxes are the next biggest issue for businesses at 17%. In the same vein, Government Red Tape and Requirements were also lower falling 3 percentage points to 11% in August. Finally, Poor Sales ranks as the third largest concern, rising 2 percentage points to 15%. That snapped a streak of three straight months of improvements in this reading and runs contrary to many other data points that have pointed to a continued turnaround in demand.


Overall, labor and government-related concerns on a combined basis account for more than half of businesses’ biggest issues. For costs or quality of labor, the 30% combined reading has been on the rise for three straight months now, but is still off the peak of 36% from late last year. Overall, that can actually be taken as a fairly positive sign for the labor market as it indicates that jobs are at least available. Click here to view Bespoke’s premium membership options for our best research available.

Optimism From the Little Guys
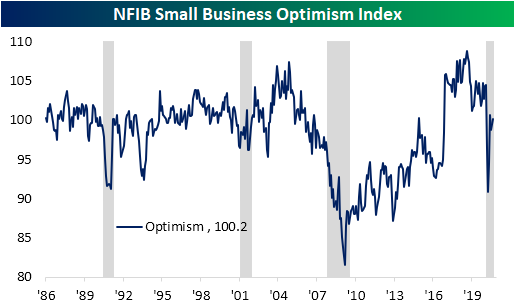
Early this morning the NFIB released the results of small business optimism for the month of August. The headline index rose 1.4 points to 100.2. That was better than expectations of 99.0 which would have been only slightly higher than July’s reading of 98.8. That indicates overall improved sentiment for small businesses in August though it remains far lower than levels from prior to the pandemic.
Of the ten individual components of the optimism index, most rose in August. Only two, Expectations for the Economy to Improve and Expectations for Real Sales to be Higher, fell while Plans to Make Capital Outlays was unchanged. The index that saw the biggest jump was for Actual Earnings Changes which rose 7 points to -25. That was the most that the index has risen in a single month since November of last year, but it still leaves it at the low end of the past decade’s range.
There is still a historically low level for expectations of future sales to be higher. That index was one of the two to fall in August as it is at its lowest level since October of 2016. Despite what appears like weak demand expectations, the net percent of owners viewing current inventories as too low stands at 3% which is in the 99th percentile of all readings. The current reading of 3 is the highest since February of 1997. As such, a higher share of businesses plan to increase inventories.
The indices covering employment were another strong point of this month’s survey. On a net basis, 21% of owners plan to increase employment which is up from 18 last month and stands in the top 5% of all readings. That index is currently right back to where it was before the pandemic began. Similarly, businesses are increasingly reporting job openings are hard to fill. That index rose another 3 points to 33 and is in the upper decile of historical readings. While improved and strong versus history, that index is much more muted relative to pre-pandemic levels than the index for Plans to Increase Employment.


Although they are not necessarily inputs into the headline number for the optimism index, some of the indices for actual changes shed some additional light on the picture for small businesses. For example, the index for Actual Sales Changes rose this month to -15 from -28 in July. That is tied with December of 1986 for the third-largest one month increase on record and the first back to back months with sequentially higher readings since November. While this still means that more businesses are reporting lower than higher sales, it also indicates that sales are continuing to turn around a bit. Meanwhile, fewer and fewer businesses are making capital expenditures. That index fell to 47 which means only 47% of businesses reported capital outlays in the last six months. That’s the lowest level since December of 2010. On the other side of the production function, labor also fell in August. The index for Actual Employment Changes fell 1 point to -12. Unlike for Capital Expenditures, though, that is not a fresh low.

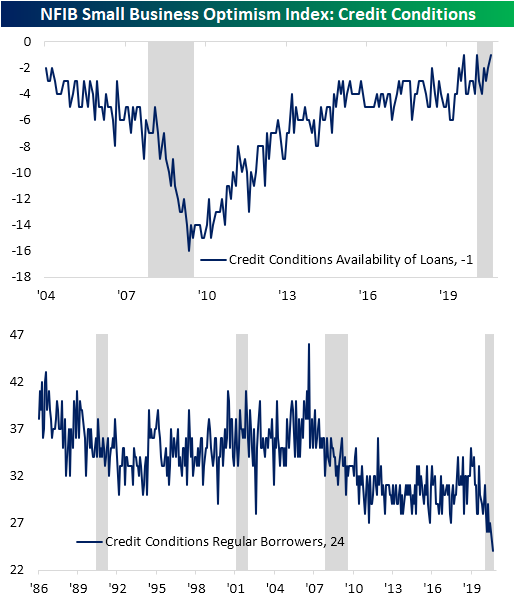
There is also an interesting divergence in readings on credit conditions. As conditions remain accommodative, the index for Availability of Loans is at its joint highest reading on record (this index only goes back to 2004). Despite this, only 24% of owners reported borrowing on a regular basis. That is a record low reading.Click here to view Bespoke’s premium membership options for our best research available.