Rates Around The World
Each Wednesday, Bespoke Institutional subscribers receive an update on fixed income markets in the US and around the world in our Fixed Income Weekly. This week, we took a look at short-term rates in the US relative to the rest of the world, with some surprising results.
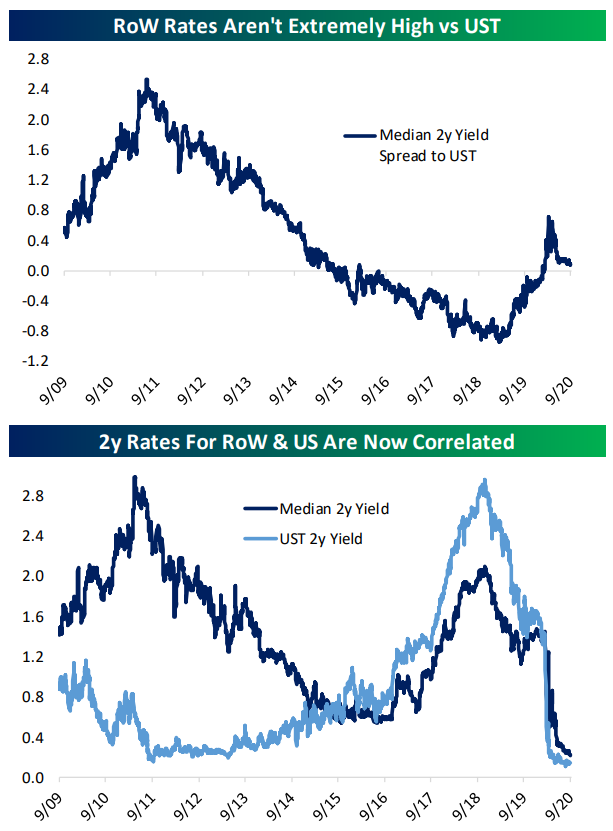
With the sudden reversal of US monetary policy to the zero lower bound in response to COVID, the widening gap between US short-term rates and the rest of the world has narrowed and is now stable just a bit above zero. It’s interesting to note that unlike the 2009-2016 period when the level of US rates and the level of rest of world rates tended to move in opposite directions, since the last tightening cycle began in earnest, US rates and rest of world rates have moved almost in lock step. In other words, monetary policy expectations have essentially been globalized.
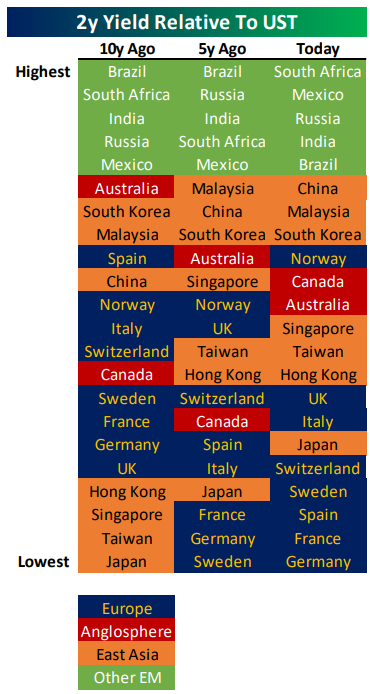
At the same time, an interesting pattern is visible within the rankings of spreads to US Treasuries among 2 year local currency government bonds for the countries that we include in our Global Macro Dashboard. In the table below, we show rankings of spreads to UST by country 10 years ago, 5 years ago, and now. We’ve added four basic geographic regions: Europe (developed), the Anglosphere (developed), East Asia (emerging), and other EM (emerging).
As shown, these economies have started to cluster more on a geographic basis. European rates are uniformly among the lowest spreads to US (other than Norway), East Asian rates are more clustered, and other EM rates are clustered at the high end. Click here to start a free trial and receive our Fixed Income Weekly for the next two weeks.
Best and Worst Performing Stocks Since the 9/2 High
Since the S&P 500 and Nasdaq peaked on September 2nd, we’ve seen rotation out of the post-COVID winners and rotation into laggards in the value space. Below we take a look at the best and worst performing stocks in the Russell 1,000 since the 9/2 high for the S&P. For each stock, we also include its YTD total return and its percentage change from the 3/23 COVID Crash low through 9/2.
Capri Holdings (CPRI) is up more than any other stock in the Russell 1,000 since 9/2 with a gain of 17.43%. Even after the recent gains, however, Capri — the holding company for brands like Michael Kors, Jimmy Choo, and Versace — is still down 52.9% year-to-date.
Only four other stocks are up more than 10% since 9/2 — Beyond Meat (BYND), PVH, Virtu Financial (VIRT), and Reinsurance Group (RGA). Interestingly, BYND and VIRT are also up big (~80%) year-to-date, while PVH and RGA are both down more than 35% year-to-date.
What stands out the most about the list of winners is that only one Technology stock made the cut — Sabre (SABR). Most names come from the two consumer sectors including cruise-liners like Carnival (CCL), Royal Caribbean (RCL) and Norwegian Cruise (NCLH), Kohl’s (KSS), Williams-Sonoma (WSM), Six Flags (SIX), Foot Locker (FL), and Ralph Lauren (RL). Both UBER and LYFT also made the cut with gains of 6% since 9/2. The 30 biggest winners since 9/2 are still down an average of 20% year-to-date, while the rest of the stocks in the Russell 1,000 are up an average of 1.46% YTD.

While only one Technology stock made the list of biggest winners since 9/2, the sector accounts for two-thirds of the 30 biggest losers over the same time frame. As shown below, since 9/2, the six worst performing stocks in the Russell 1,000 and ten of the worst twelve all come from Tech. Notably, though, these 30 stocks that have all fallen more than 12% since 9/2 are still up an average of 5.6% YTD. Were it not for the horrid YTD performance of the Energy stocks that made the list, the average YTD gain would be even higher. Receive Bespoke’s most actionable research and access our Trend Analyzer and Chart Scanner tools with a two-week free trial to Bespoke Premium.

Jobless Claims Flat
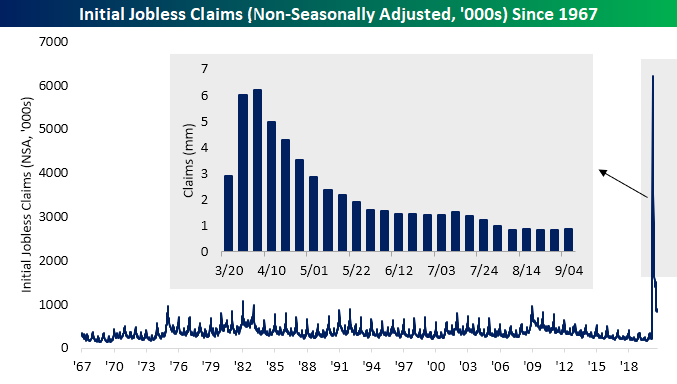
Things were actually pretty calm this week for jobless claims. For the first time since August of last year, initial jobless claims were unchanged this week relative to last week’s 3K upwardly revised number of 884K. That was above forecasts of a reading 34K lower at 850K. With the caveat that comparisons of the past two weeks to prior readings are not exactly like for like on account of a change to the seasonal adjustment methodology (which we discussed in greater detail last week), that 884K reading is still a very high level of claims relative to history but is at the low end of readings since the pandemic began.

Non-seasonally adjusted claims were higher this week by 20.1K coming in at 857.1K. That is the second consecutive week with higher claims by this measure and which leaves claims at their highest level since August 20th. Granted, that is still at the low end of the range since the pandemic began.
Continuing claims (seasonally adjusted) saw similar results with a slightly higher reading of 13.385 million compared to 13.292 million last week. As with seasonally adjusted initial claims, the caveat with comparisons of pre-September readings still applies, but this was the first time seasonally adjusted continuing claims rose in five weeks.

Taking into account Pandemic Unemployment Assistance (PUA), total initial claims have continued to worsen with the total count now at 1.7 million; up from 1.58 million last week and the highest since July 24th. The bulk of that increase comes from PUA claims which were up to 0.84 million from 0.75 million last week. This week marked a fourth consecutive week that both PUA claims and the total (PUA plus regular) claims have risen week over week. Continuing PUA claims for the week of August 21st which are lagged an additional week to regular continuing claims also rose with the most recent reading of 14.6 million marking a pandemic high. Even though regular claims are off their peak and have been trending lower, that leaves total continuing claims at the highest level since mid-July.
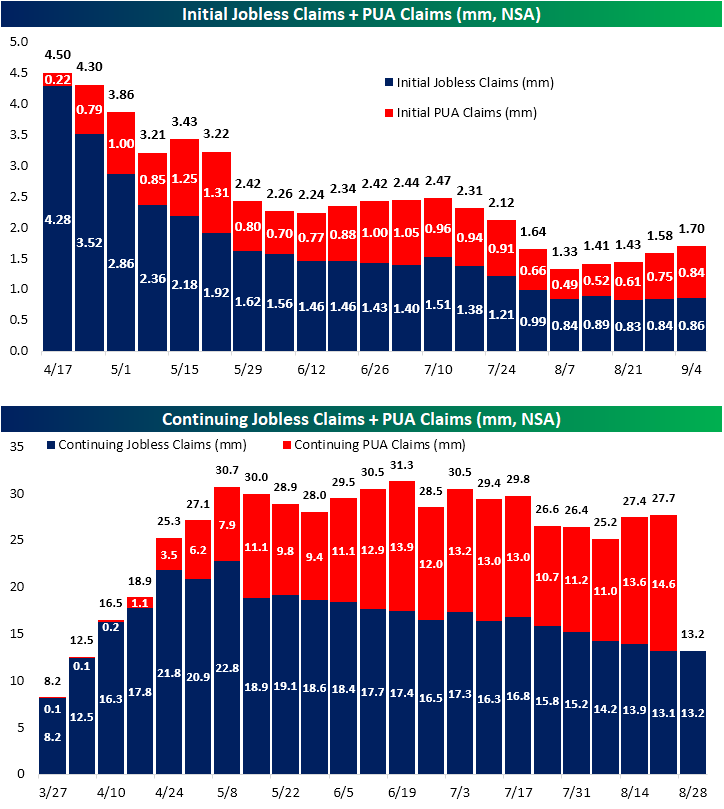
One interesting point of this data is that this weakness comes at a time of year in which claims have tended to turn around and head higher. As shown below, on a non-seasonally adjusted basis, this time of year on average has marked the annual bottom for NSA claims with the bottom for continuing claims typically coming a bit later before both rise into the end of the year. In other words, it is hard to say to what degree it is the case, but the recent uptick in both initial and continuing claims (especially taking into account PUA claims) could at least partially be a result of seasonality. Click here to view Bespoke’s premium membership options for our best research available.

Chart of the Day: Material Moves
Correction Crushing Sentiment
With the Nasdaq entering a correction in under a week and the S&P 500 dropping just over 7% from last Wednesday’s closing high to Tuesday’s low, investor sentiment has understandably taken a hit. After a four-week stint in which the percentage of investors reporting as bullish in the American Association of Individual Investors (AAII) survey stayed above 30%, this week less than a quarter of respondents are bullish. At 23.71%, bullish sentiment is at its weakest level since the first week of August when it was 23.29%. Additionally, the 7.09 percentage point decline was the largest one week drop in bullish sentiment since mid-June when it fell 9.91 percentage points.
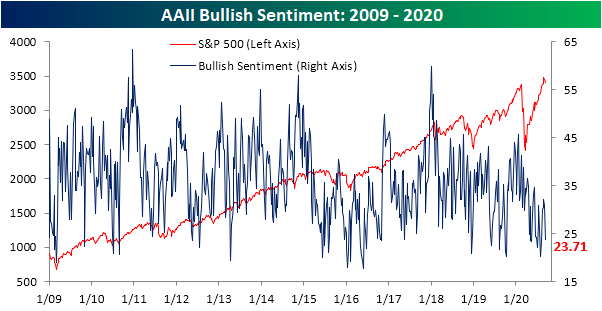
The decline in optimism was obviously met with a similar-sized increase in pessimism. The percentage of investors reporting as bearish rose 6.68 percentage points this week to 48.45%. That is the highest reading since the last week of July when bearish sentiment stood slightly higher at 48.47%. It was also the largest one week gain to bearish sentiment since June 18th. As shown in the chart below, that is at the high end of the past few months’ range but is still off the highest readings of the pandemic when more than half of respondents reported as bearish.

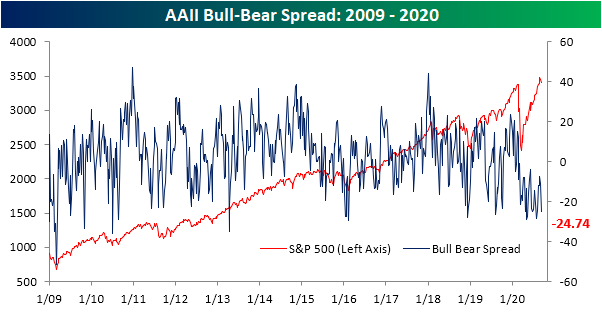
With the big moves in bullish and bearish sentiment, the bull-bear spread moved deeper into negative territory (which it has been in for a record 29 weeks now) falling from -10.97 to -24.74 this week. That brings the spread back to similar levels to the end of July. Since the pandemic began, there have only been five other weeks that the spread has been lower: the last week of July, June 25th, May 7th and 14th, and April 23rd. In other words, bearish sentiment continues to dominate.
Meanwhile, over a quarter of respondents are neutral on the market. 27.84% of respondents to the AAII survey reported as expecting no change in the S&P 500 over the next six months which was little changed from 27.43% last week and is basically right in line with the average of 25.77% since the bear market low in March. Click here to view Bespoke’s premium membership options for our best research available.

Bespoke’s Morning Lineup – 9/10/20 – Heads or Tails?
See what’s driving market performance around the world in today’s Morning Lineup. Bespoke’s Morning Lineup is the best way to start your trading day. Read it now by starting a two-week free trial to Bespoke Premium. CLICK HERE to learn more and start your free trial.
“Seek advice on risk from the wealthy who still take risks, not friends who dare nothing more than a football bet.” – J. Paul Getty
It’s that time of year again as the NFL is set to kick off its season this evening as it typically does every year on the first Thursday after Labor Day. The season will go off as usual with a full season, playoffs, and the Super Bowl LV on February 7, 2021. Why are we even talking about this? Because after six months of abbreviated seasons and canceled events in the world of sports, the return to a normal season for a major league is a step in the right direction. Some degree of normality in just a small part of their lives is what just about everyone could use right now. The Chiefs even plan to allow fans to the stadium for tonight’s game against the Texans. While ticket sales were capped at 16,000, for some teams these days, that’s a perfectly normal crowd.
In economic data this morning, jobless claims were higher than expected on both an initial and continuing basis, while revisions to last week’s report were minimal. On the inflation front, PPI came in slightly higher than expected. Futures were modestly lower on the S&P 500 and higher for the Nasdaq heading into the release and basically remained there after the report as well.
Be sure to check out today’s Morning Lineup for a rundown of the latest stock-specific news of note, market performance in the US and Europe, trends related to the COVID-19 outbreak, and much more.

Where the market goes from here in the short-term is basically a coin-flip, and the S&P 500 intraday chart from the last week has something for both the bulls and bears. On the bullish side, yesterday’s open broke what was starting to look like a downtrend from the high on 9/2. As the market rallied throughout the day yesterday, though, it ran out of steam right at Friday’s close. So until that level from Friday can be broken to the upside, the bears are on top.

Daily Sector Snapshot — 9/9/20
JOLTS Show Some Return To Normalcy
Today’s Job Openings and Labor Turnover Survey (JOLTS) report from the Bureau of Labor Statistics (BLS) on the flows in and out of jobs as well as the number of job openings was pretty encouraging. As shown in the first pair of charts below, the number of open jobs as a percentage of the labor force has surged back to pre-pandemic levels and is close to the very strong levels seen at the prior peak. This is a good sign that labor demand is holding up pretty well in aggregate.

Also encouraging is that while not at extreme lows, layoff and discharge rates are back to the levels they sat at in 2019. Instead of settling at a new higher level, the 1.4% private sector layoff and discharge rate is at the same level it was at numerous times during 2019 and the first two months of 2020. Hiring, which crashed and then surged as businesses started to reopen, was 4.1% the labor force in July. That was a stronger pace than any month in the history of the last expansion.

Finally, we think quit rates are about the best indicator of labor bargaining power available. As shown, they are bouncing and bouncing hard. They have not fully recovered from COVID’s hit, but the size and speed of the bounce is consistent with a very strong trajectory for labor markets relative to what other indicators (for instance, permanent job losses in the Employment Situation Report, or the level of unemployment claims) are saying. We will have more granular analysis of the JOLTS report tonight in The Closer. Click here to start a free trial and receive The Closer tonight with more analysis on the JOLTS report for July.

B.I.G. Tips — The Market? Or a Market of Stocks?
Pullback Seen Around the World
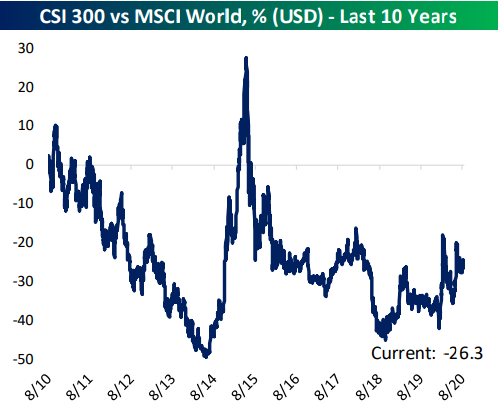
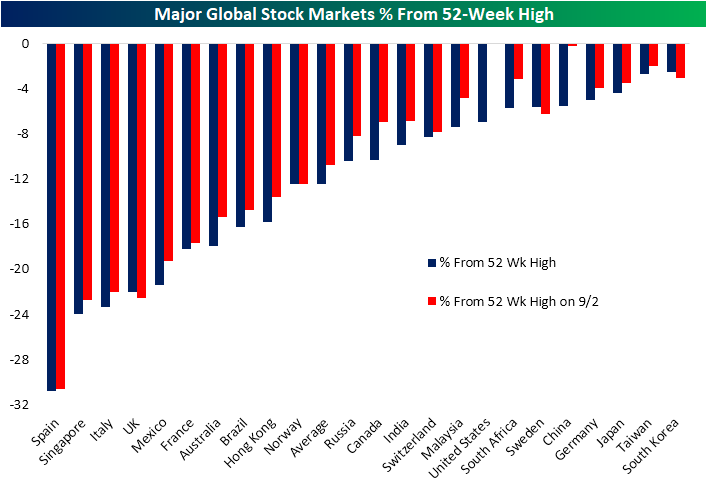
Through yesterday’s close, the S&P 500 has fallen just under 7% from its high on September 2nd. Compared to other major global stock markets that we track in our Global Macro Dashboard, only China has also fallen over 5% in the past week. The average global stock market of these 23 markets is down 1.8% since 9/2. Only three—South Korea, Sweden, and the UK—have risen in the past week. In other words, stocks have dropped around the globe but the US and China’s declines have far outpaced the rest of the world.

One interesting point of the past week is these declines have only brought US stocks off of their 52-week highs. As of last Wednesday, whereas US equities were at a record high, the average global stock market was over 10% below its 52-week high. As shown below, other than the US, the only other country that was within 1% of a 52 week high last week was China; the second-largest decliner in the past week. After those large declines in the past week, the US and China stand out far less than they did last week in terms of distance from 52 week highs.
That dynamic of the US outpacing its global peers is nothing new though. As shown in the chart from our Global Macro Dashboard below, the US has consistently outperformed the rest of the world over the past ten years (a rising line indicates outperformance and vice versa). While its relative strength has been more mixed over the past ten years, China has similarly seen its equities outperforming recently. Click here to view Bespoke’s premium membership options for our best research available.