Bespoke Brunch Reads: 9/13/20
Welcome to Bespoke Brunch Reads — a linkfest of the favorite things we read over the past week. The links are mostly market related, but there are some other interesting subjects covered as well. We hope you enjoy the food for thought as a supplement to the research we provide you during the week.
While you’re here, join Bespoke Premium with a 30-day free trial!
Pandemic Payoffs
Golf sees huge upswing with women and young adults: ‘You can take your bag full of White Claws’ by Melody Hahm (Yahoo! Finance)
Left for dead by shifting demographics and no taste for the links among younger folks, golf is suddenly getting a massive boon from COVID, with low disease risk and spare capacity for folks to head out and hit some balls. [Link; auto-playing video]
Locked Down in the Ritz-Carlton: Winning the Quarantine Hotel Lottery by Chong Koh Ping (WSJ)
Folks arriving in Singapore must pass a mandatory 14 day quarantine, but the hotel they spend their time at is assigned by lottery. For some, that lottery is a big payoff. [Link; paywall]
Battery Power
Pandemic e-commerce surge spurs race for ‘Tesla-like’ electric delivery vans by Nick Carey (Reuters)
In addition to targeting zero-emissions, last mile logistics companies are also looking for capabilities like autonomous driving and analytics which are already a part of basic Tesla capabilities. [Link]
Why Tesla’s Battery Day Will Actually Live Up to the Hype by Steve LeVine (Medium)
In a couple of weeks, Tesla will host a live webcast “battery day” alongside the company’s shareholders meeting; reading the tea leaves, it’s possible that CEO Elon Musk will announce its battery technology efficiency has improved to cost-parity with gasoline cars. [Link]
Alternative Approaches
To Manage Wildfire, California Looks To What Tribes Have Known All Along by Lauren Sommer (NPR)
Historically, Indigenous people around North America actively used wildfires as a way to manage the biosphere; returning to managed burns could reduce the scale and intensity of fires which have wracked California in recent summers. [Link]
Call police for a woman who is changing clothes in an alley? A new program in Denver sends mental health professionals instead. by Elise Schmelzer (The Denver Post)
A pilot program in Denver that focuses on mental health and social service intervention instead of police presence has led to a successful series of de-escalations rather than arrests and confrontation. [Link]
A $12 Billion Trust Fund Is About to Crack Open for U.K. Teens by Edward Robinson (Bloomberg)
15 years ago the Blair government created a trust fund that included government contributions, market gains, and family contributions to accounts. The first generation of recipients is set to start receiving the money this year, providing a firmer financial footing for all UK young adults. [Link]
Doomed Enterprises
Those boats in Texas paraded at the wrong speed by Brendan Greeley (FTAV)
You might think a boat parade would be a pretty straightforward enterprise, but the physics can get very complicated and very dangerous in a hurry, as was the case in Texas this week. [Link; registration required]
A Gender-Reveal Celebration Is Blamed for a Wildfire. It Isn’t the First Time. by Christina Morales and Allyson Waller (NYT)
A “smoke-generating pyrotechnic device” designed to spew the gender of a baby ignited a fire that consumed thousands of acres near Los Angeles, one of a number of similar incidents in recent years as the trend of over-the-top gender reveals and extreme wildfire conditions have coalesced. [Link; soft paywall]
Social Media
WeChat and TikTok Taking China Censorship Global, Study Says by Jamie Tarabay (Bloomberg)
Chinese social media apps used in the US often censor content deemed sensitive by the Chinese government, one among many reasons that Chinese tech is decoupling from the rest of the world. [Link; soft paywall]
Trading
NYSE Exchanges to Prepare for Potential Move From New Jersey by Stacie Sherman (Bloomberg)
In response to New Jersey’s discussion of a financial transaction tax, NYSE is preparing to move its digital infrastructure across state lines to dodge the tax. [Link; soft paywall]
Read Bespoke’s most actionable market research by joining Bespoke Premium today! Get started here.
Have a great weekend!
The Bespoke Report — Momentum Matters Most
It was a rough week to own stocks as the Nasdaq 100 dragged down the broader US equity market. While the failure to introduce a new bill to continue easing fiscal policy has been ignored by markets for the most part, the breakdown of upward momentum coupled with that policy flop clouds the outlook…even as the economy is improving and the spread of COVID also eases. Broken moving averages and weak technical set-ups don’t mean markets are poised to crash, but the backdrop has gotten worse over the past week. We discuss all these items in detail along with economic data in the US and around the world, low rates in the US, and how the COVID pandemic has impacted Americans in this week’s Bespoke Report.
This week’s Bespoke Report newsletter is now available for members.

To read the report and access everything else Bespoke’s research platform has to offer, start a two-week free trial to one of our three membership levels. You won’t be disappointed!

Daily Sector Snapshot — 9/11/20
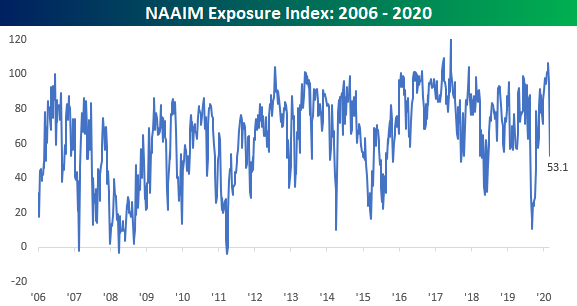
Active Managers Do an About Face
The National Association of Active Investment Managers (NAAIM) has an index which tracks the exposure of its members to US equity markets. Each week, members are asked to provide a number that represents their exposure to markets. A reading of -200 means they are leveraged short, -100 indicates fully short, 0 is neutral, 100% is fully invested, and 200% indicates leveraged long. Two weeks ago, in our Bespoke Report, we highlighted the fact that the exposure index had moved to one of the highest levels in its 15-year history. Now, just two weeks later, these same active managers have reigned in their exposure considerably as this week’s reading dropped from just under 100 to 53.1.
This week’s drop was the second-largest one week decline in the index’s history and just the 10th time that the index lost more than a third (33 points) in a single week. The most recent occurrence was back in early March in the middle of the Covid crash, and every other prior period where the index saw a similar drop, the S&P 500 was also down every time by an average of 2.3%. Therefore, it’s not much of a surprise to see the big drop this week given the big declines in the market. But what about going forward? Do big drops in the NAAIM Index mean a bounce back for markets or further declines? Find out in this weekend’s Bespoke Report newsletter where we cover this much more in depth. If you aren’t currently a client of any of Bespoke’s research services, make sure to sign up for a free trial today in order to unlock access to this week’s report.
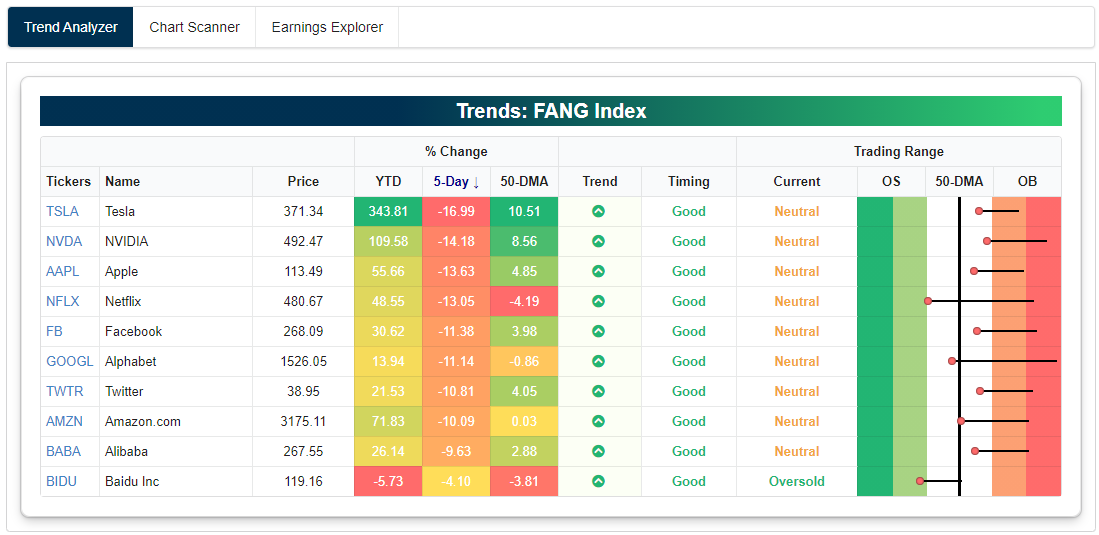
Mean Reversion Shows up in Trend Analyzer
Our popular Trend Analyzer tool is a very helpful way for Bespoke members to monitor overbought and oversold levels for large baskets of stocks or ETFs across asset classes. Below is a snapshot of major US index ETFs from our Trend Analyzer tool as of this morning.
When looking at the Trend Analyzer’s “Trading Range” section (far right of snapshot), the dot for each stock or ETF represents where its share price is currently trading relative to its 50-day moving average (DMA). In the snapshot below, the 50-DMA for each ticker is represented by the vertical black line in the middle of the trading range. Price is below the 50-DMA when it is to the left of the 50-DMA line and above the 50-DMA when it is to the right of the black line. Additionally, the tail for each ticker in the Trading Range section shows where the stock or ETF was relative to its range one week ago. So when the dot is to the left of the tail, it means price moved lower within its trading range over the last week. When the dot is to the right of the tail, it means price moved higher within its trading range over the last week.
Long tails mean price moved a lot over the last week on a relative basis, while short tails indicate little price movement. In today’s snapshot of US index ETFs, you can see that all of them have long tails with price moving lower over the last week. This highlights the significant downside mean reversion that US equities have experienced recently. In early September, pretty much everywhere you looked, prices were very overbought (extended well above their 50-day moving average). Over the last week or so, however, as equities have sold off they’re now trading at more neutral levels within their trading ranges.
When looking for an entry point or exit point on a position, it’s useful to take overbought or oversold levels into account. We use our “Timing” score within the Trend Analyzer to help members identify attractive (or unattractive) set ups. Members looking to add a new position or add to an existing position like to do so when price is trading at neutral or oversold levels as opposed to placing a bid when price is extremely overbought.

Looking at US sector ETFs, our Trend Analyzer shows that all of them have moved lower within their trading ranges over the past week, which gives them “Good” timing scores as opposed to the “Poor” timing scores these same ETFs had when they were trading at extreme overbought levels a few weeks ago.
The Energy sector (XLE) is the main outlier here with an extreme oversold reading. While every other sector is either neutral or overbought (Materials), Energy just can’t seem to get out of its own way this year. The sector entered today down 7.5% over the last week, 10.84% below its 50-day moving average, and down 43.7% year-to-date.

Finally, below is a snapshot of the stocks that make of the NYSE FANG+ index run through our Trend Analyzer. Similar to what we’ve seen around the rest of the US equity space recently, all of the FANG+ stocks are down significantly over the last week (8 of 10 down 10%+), and this has caused most of them to move out of overbought territory and back into neutral territory. For those that have been waiting for a pullback in these names to add exposure, now you’ve gotten it. Click here to start a free trial to Bespoke Premium and immediately gain access to our Trend Analyzer tool.
Bespoke’s Morning Lineup – 9/11/01 – Looking to Go Out on a Good Note
See what’s driving market performance around the world in today’s Morning Lineup. Bespoke’s Morning Lineup is the best way to start your trading day. Read it now by starting a two-week free trial to Bespoke Premium. CLICK HERE to learn more and start your free trial.
“The report continues to be that a plane hit the World Trade Center.” – Mark Haines, CNBC 9/11/01
While there’s now an increasing number of people who have no recollection of the 9/11 attacks, there’s still an even larger percentage of us who can’t believe it has already been 19 years. We can all still remember exactly where we were and what we were doing at the time.
It was a crisp and sunny fall day, and futures were trading higher after what had been an inexplicably weak number of days where the market did nothing by trade lower with little in the way of any bounces. On the morning of 9/11, stocks were looking up for a change. Then, someone in the office turned the volume up on the TV as Mark Haines broke away from an interview to show the billowing smoke coming out of the North Tower. In the minutes that followed, the details became clear, and the last thing that anyone cared about was what they were just doing or the plunging futures.
Futures are higher this morning too as the market attempts to recover from a much more explicable decline in the markets over the last week as growth stocks attempt to work off extremely overbought conditions. The economic calendar is relatively quiet with CPI the only release on the calendar
Be sure to check out today’s Morning Lineup for a rundown of the latest stock-specific news of note, market performance in the US and Europe, trends related to the COVID-19 outbreak, and much more.

Yesterday, we showed the intraday chart of the S&P 500 since the high on 9/2. Today, we are updating it to show yesterday’s action as well. After opening higher, the S&P 500 once again ran into resistance at last Friday’s closing level (as it also did on Wednesday afternoon) and then traded lower all day. By the closing bell, Friday’s highs were a distant memory, and traders were breathing a sigh of relief that Tuesday’s lows held.
As things stand this morning, the S&P 500 will open right in the middle of yesterday’s range. Given the moves we’ve seen of late, it’s highly likely that at some point in the day we will encounter yesterday’s high or low and maybe even both. How the market reacts to either of these levels will then likely dictate the tone going into next week.

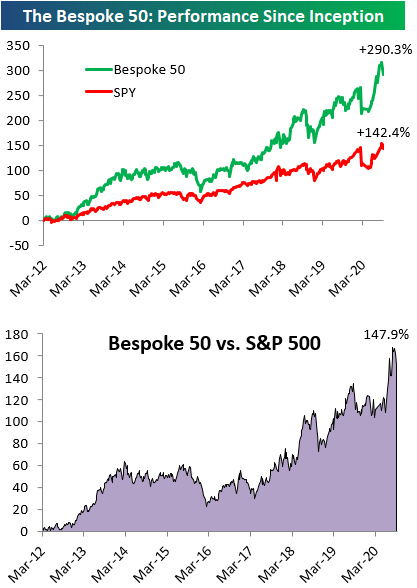
The Bespoke 50 Top Growth Stocks — 9/10/20
Every Thursday, Bespoke publishes its “Bespoke 50” list of top growth stocks in the Russell 3,000. Our “Bespoke 50” portfolio is made up of the 50 stocks that fit a proprietary growth screen that we created a number of years ago. Since inception in early 2012, the “Bespoke 50” has beaten the S&P 500 by 147.9 percentage points, which hit a new high this week. Through today, the “Bespoke 50” is up 290.3% since inception versus the S&P 500’s gain of 142.4%. Always remember, though, that past performance is no guarantee of future returns. To view our “Bespoke 50” list of top growth stocks, please start a two-week free trial to either Bespoke Premium or Bespoke Institutional.
Bespoke’s Weekly Sector Snapshot — 9/10/20
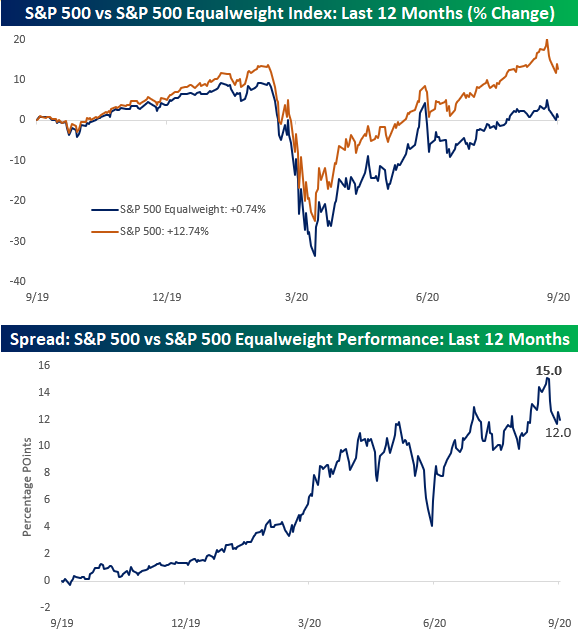
Gap Between Market Cap and Equalweight Shrinks a Bit
From the lows in March right up to now, one of the number one preoccupations of investors has been the widening gap between the market-cap-weighted S&P 500 and the equal-weighted index. When the market-cap-weighted index outperforms the equal-weight index, it indicates that stocks with the largest market caps are outperforming their relatively smaller peers and vice versa when the equal-weight index outperforms. As shown in the top chart below, through this afternoon, the S&P 500 has rallied more than 12.74% over the last year compared to a gain of just 0.74% for the equal-weight index for a gap of 12 percentage points.
The second chart below shows the performance spread between the S&P 500 and the equal-weighted index over the last 12 months. While the spread is wide now, just over a week ago it was even wider at 15 percentage points. The sell-off of the last few days has certainly narrowed the gap a bit, but there is still a lot of space between the two indices where they sit now. If the recovery from the pandemic recession continues, we would expect to see some broadening out of performance across market caps, but if the recovery derails or hits a roadblock, then the largest of the largest stocks could see their lead start to widen again. Click here to view Bespoke’s premium membership options for the best market analysis available.
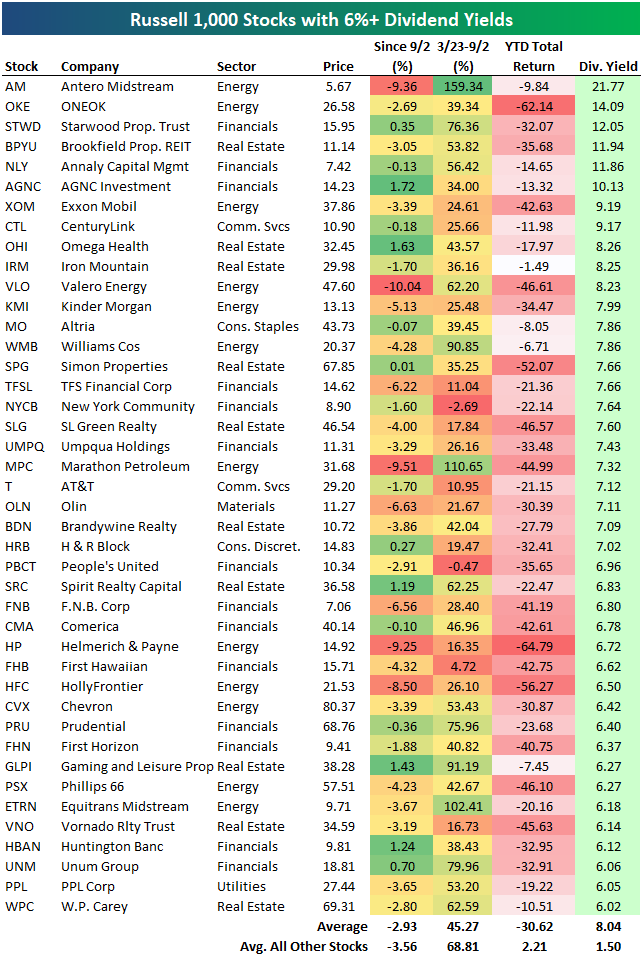
A Look at the Highest Dividend Yields in the Russell 1,000
There are currently 42 stocks in the Russell 1,000 that have dividend yields of more than 6%. These 42 stocks are listed in the table below. Given that every single one of these stocks is down on a year-to-date basis, and many are down 30-50%, the stability of these dividends is certainly in question. Many names on the list are from the beaten-down Energy sector. Antero Midstream (AM) has an indicated yield of 21.77% at the moment, followed by ONEOK (OKE) at 14%. Other Energy names on the list include Exxon Mobil (XOM) with its yield of 9.19%, Valero Energy (VLO) at 8.23%, and Marathon Petroleum (MPC) at 7.32%.
One of the only stocks on the list that’s not from the Energy, Financials, or Real Estate sectors is AT&T (T). AT&T is still down more than 20% year-to-date, and it has an indicated yield of 7.12%. Click here to view Bespoke’s premium membership options for our best research available.