Daily Sector Snapshot — 9/28/20
Chart of the Day: It’s Almost Over
Wave Three?
“By early October the first fall outbreaks and the memory of those in the spring had already suggested that the virus attacked in a cycle; it took roughly six weeks from the appearance of the first cases for the epidemic to peak and then abate in civilian areas, and from three to four weeks in a military camp with its highly concentrated population. After the epidemic abated, cases still occurred intermittently, but not in the huge numbers that overwhelmed all services.” – John M. Barry, The Great Influenza: The Story of the Deadliest Pandemic in History

If you’re looking for an account of the 1918 flu pandemic as well as a great example of history repeating itself in terms of mistakes and lessons learned, John Barry’s book on the subject is a must-read. In reading through it, so many aspects of the pandemic in 1918 have similarities to the COVID pandemic in terms of the virus’s progression and how people reacted to it. In looking at the latest trends in the current outbreak of COVID across the country, we were reminded of one such similarity described in the above quote which described the ebb and flow of the virus across the country in 1918.
The chart below shows the seven-day average in the number of daily confirmed COVID cases across the United States. The first wave of the COVID outbreak, which was centered in the northeast, began on 2/24 when the US started to average at least one new confirmed COVID case per day. That wave peaked 46 days later on April 10th. Over the next 48 days, the number of cases gradually drifted lower through the end of May. On 5/28, the decline in cases reached a low, but then started rising again as the second wave of the outbreak flared up in the sunbelt.
During the second wave of the outbreak, the number of cases quickly increased to new highs before peaking on July 22nd, a period spanning 55 days. As case counts across the sunbelt surged, states in the northeast continued to see cases but not to nearly the same degree as they did during the first wave. From 7/22 through 9/12 (52 days), the second wave of the outbreak started to ebb, but ever since then, we’ve started to see a renewed uptick in cases. This time, however, the states most affected by this third wave of the outbreak have been concentrated in the midwest, while case counts in the states impacted by the first two waves are nowhere near their prior peaks.
What’s also notable about the first two waves of the outbreak is that all of the legs higher and lower have spanned a period of between 46 and 55 days or six to eight weeks. That’s similar to the ‘roughly six weeks’ that each wave lasted during the 1918 pandemic. Given the fact that the second wave saw more cases than the first wave, does that mean the third wave will see a higher number of cases than the second? Not necessarily. Anything can happen but with the states being hit hardest by COVID now collectively having smaller populations and less geographic density than the areas hit hardest in the first two waves, the likelihood of larger caseloads would seem less likely.

Taking the seven-day average case counts from notable states around the country further illustrates the similarities between now and 1918. States like New York, Arizona, Florida, and California all appear to be past the peaks of the epidemic in their regions, and while case counts haven’t disappeared, new reported cases have been much less frequent and continuous than they were at their peaks. Meanwhile, states in the midwest, like Missouri, which were previously spared by much of the new case burden, are only just now hitting the peaks of their outbreaks. How the COVID-19 pandemic progresses from here through the winter months is impossible for anyone to predict, but the fact that the current outbreak has been following similar patterns to the way the 1918 pandemic played out provides some degree of encouragement. Like what you see? Click here to for a free trial to Bespoke’s premium membership options.

Eleventh District Elevates
The final regional Fed manufacturing survey of the month was out today with the release of the Dallas Fed’s manufacturing survey. General business activity rose 5.6 points in September to 13.6. That marks back to back months with expansionary activity since August and September of last year. This month also marked the strongest reading since November of 2018 as the index has risen for five straight months. After pulling back in the early summer, the index for expectations of general business activity has continued to rebound in a big way rising to 28 from 20.4 last month. That is now at the highest level since October 2018 indicating a generally positive outlook for the future.

With general business activity improved, breadth in this month’s report continued to be strong. Consistent with other surveys this month, the only index that remains in contraction is that of Finished Good Inventories. While it remains in contraction, this month’s 15.4 point rise was a big improvement from the prior month when the index stood at a reading of -17.3. That is the highest level since March of last year. Of the other components, there were four that fell in September: Company Outlook, Unfilled Orders, Shipments, and Hours Worked. Although these indices fell, they each remain in the upper quintile of their respective historical ranges with readings that indicate further growth, just at a slower pace than August.

One major strength of recent manufacturing data has been surging order volumes. The Dallas Fed’s survey for September was no exception as the index for New Orders rose for a fifth straight month to 14.7. The only higher reading in the past two years was back in January of this year. Not only did new orders rise, but it was also at a faster clip than August as the index for New Orders Growth rose to 13.2 from 11.8. Again this was the highest reading since the second half of 2018. While both indices remain around some of their strongest levels of the past couple of years, Unfilled Orders and Shipments both fell by 1.8 points in September. That was the second consecutive lower reading for Unfilled Orders and the first since April for shipments. Regardless of those declines, these indices all show that businesses continue to increasingly receive and fill orders at a strong rate.

Given that orders remain high and inventories continue to be worked off, production has continued to ramp back up. The index for production rose to 22.3 which brings the index right back to where it was two years ago.

With production on the rise, so too is employment. Hours worked continued to rise (albeit at a slowed pace from August) and the index for Employment rose to 14.5 as a higher share of businesses report net hirings than firings. This index is now at its highest level in one year. Click here to view Bespoke’s premium membership options for our best research available.

2020 Weekday Market Performance
Below is an updated look at the performance of the S&P 500 by weekday so far this year. The numbers shown highlight how you’d be doing this year if you only owned the S&P 500 on each weekday.
Tuesday tops all other days on the upside while Thursday stands out on the downside. If you only owned the S&P on Tuesdays this year, you’d be sitting on a gain of 16.5%. If you only owned on Thursdays, however, you’d be down 15.3%.
Wednesdays and Mondays have both returned slightly positive numbers, while Fridays are just barely in the red at -0.7%. As you can see in the chart, Mondays, Wednesdays, and Fridays have been creeping higher and higher over the past few months, while Tuesdays have actually been somewhat flat since seeing a big jump earlier in the year. Thursday is the one weekday that continues to see weakness as we get set for the fourth quarter. Click here to view Bespoke’s premium membership options for our best research available.

Taking Flight
After some volatility in the pace of air traffic where passenger throughput surged early in the month and then quickly came back down to earth in the middle of the month, the number of Americans traveling through US airport security checkpoints has been back on the rise in recent days as the 7-day average through Sunday stood at 730,491, which is less than 50K from the peak level in early September.
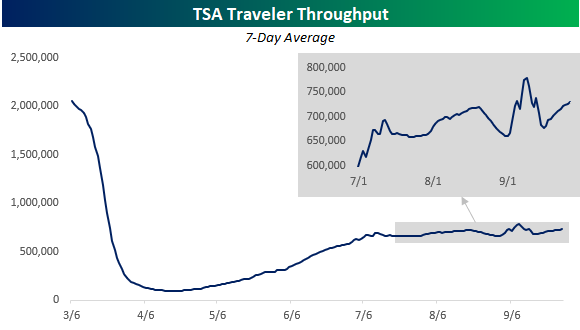
While air-traffic trends are improving, relative to last year, total traffic is still down by more than two-thirds (-68.43%). In the chart below, we show the y/y change in TSA passenger throughput (blue line, left axis) to the performance of the Airline ETF (JETS). While the two haven’t tracked each other step for step, there has certainly been a link between the two. While the surge in JETS in late May/early June got ahead of itself and subsequently reversed much of those gains, as y/y traffic trends stabilized in the down 60%-70% y/y range, JETS has also stabilized in the high teens. In order for JETS to get back up to its highs from June, traffic trends will need to start seeing a material acceleration. Click here to view Bespoke’s premium membership options for our best research available.

Bespoke’s Morning Lineup – 9/28/20 – Stimulated Markets
See what’s driving market performance around the world in today’s Morning Lineup. Bespoke’s Morning Lineup is the best way to start your trading day. Read it now by starting a two-week free trial to Bespoke Premium. CLICK HERE to learn more and start your free trial.
“Do more of what works and less of what doesn’t.” – Steve Clark
Will we or won’t we? Investor hopes over a potential new round of stimulus/relief out of Washington have been on the rise this morning after House Speaker Pelosi has indicated that she still thinks a deal with the White House is possible and that both she and Treasury Secretary Mnuchin have agreed to restart informal talks. With Pelosi and Democrats still at $2.3 trillion and the White House and Republicans refusing to go above $1.5 trillion, there’s still a wide gap, but at least they’re talking.
Be sure to check out today’s Morning Lineup for a rundown of the latest stock-specific news of note, market performance in the US and Europe, trends related to the COVID-19 outbreak, and much more.

In last week’s trading, the Nasdaq 100 was the only one of the major US index ETFs to finish the week in the green, but a number of other indices came close with the S&P 100, Russell 1000, and S&P 500 all finishing down less than 1%. With today’s rally at the open, all of these indices will erase last week’s losses right at the open and could even make a run at reclaiming their 50-day moving averages. Mid and small caps, on the other hand, will all need a bit of an added boost to erase last week’s losses, though. What is encouraging about the setup heading into the week, is that the timing scores on all of the ETFs shown currently rank as ‘Good’.

Bespoke Brunch Reads: 9/27/20
Welcome to Bespoke Brunch Reads — a linkfest of the favorite things we read over the past week. The links are mostly market related, but there are some other interesting subjects covered as well. We hope you enjoy the food for thought as a supplement to the research we provide you during the week.
While you’re here, join Bespoke Premium with a 30-day free trial!
COVID
J&J offers PhI/IIa data showing its single-dose vaccine can stir up sufficient immune response by Amber Tong (Endpoints News)
The outlook for vaccine coverage got a shot in the arm this week as Johnson & Johnson’s early stage data revealed that a single dose gave 98% of participants neutralizing antibodies 29 days after administering just one dose of vaccine. [Link; soft paywall]
How Italy Snatched Health From the Jaws of Death by Elisabeth Braw (Foreign Policy)
After a horrifying first wave, Italians have avoided seeing a resurgence in COVID infections, unlike many of their European neighbors. [Link]
SARS-CoV-2 Transmission Dynamics Should Inform Policy by Muge Cevik, Julia Marcus, Caroline Buckee, and Tara Smith (SSRN)
A detailed review of possible mitigation strategies based on the results of contract-tracing studies. Lower income and high-occupant households are key to the strategy. [Link]
A Notorious COVID Troll Actually Works for Dr. Fauci’s Agency by Lachlan Markay (Daily Beast)
One of the National Institute of Allergy and Infectious Diseases’ PR team has been waging an online disinformation campaign designed to undermine NIAID communications related to COVID. [Link]
“Security”
Ring’s latest security camera is a drone that flies around inside your house by Dan Seifert (The Verge)
Home surveillance company Ring is rolling out an aerial drone designed to be used inside the home, allowing users to remotely activate and patrol when they’re away. [Link]
Texas Deployed SWAT, Bomb Robot, Small Army of Cops To Arrest A Woman And Her Dog by Seth Harp (The Intercept)
Police shut down an entire bridge because they thought a woman’s car decorations meant she was carrying a bomb. [Link]
Schools
Temperature Isn’t a Good Litmus Test for Coronavirus, Doctors Say by Sumathi Reddy (WSJ)
Schools and a variety of other institutions have been using temperature as a proxy for COVID infection, but the loose proxy for infections might be much less useful than widely hoped. [Link; paywall]
New York’s Online Class Sizes Could Reach Nearly 70 Students by Lee Hawkins (WSJ)
With NYC’s in-person reopening of classrooms pushed back, online learning programs may be overwhelmed by students who had planned for in-person learning. [Link; paywall]
Forgone Growth
Citi Pledges to Become Antiracist, Review Internal Policies by Jennifer Surane (Bloomberg)
A new Citigroup report estimates that economic discrimination against Black Americans has cost the US economy $16trn over the last 20 years via lost wages, less education, and less access to loans for business or homeownership. [Link; soft paywall]
Americans Want Homes, but There Have Rarely Been Fewer for Sale by Nicole Friedman (WSJ)
Thanks to both longer-term structural patterns including demographics and the shorter-term drive of lower interest rates and the COVID pandemic, there aren’t many houses available to buy these days. [Link; paywall]
Conservation
Botswana says toxins in water killed hundreds of elephants by Brian Benza (Reuters)
Bacterial blooms in drinking water that produce toxins that are toxic to animals are responsible for the deaths of hundreds of elephants, a devastating side-effect of climate change for an already stressed population. [Link]
Airbus has revealed three zero-emission plane designs that could become reality in just 15 years — take a look at the hydrogen-powered aircraft of the future by David Slotnick (Business Insider)
Hydrogen powered planes are being touted by Airbus as a potential climate solution, with three concept models in the works and potentially ready within 15 years. [Link]
Sustainability Timeline: Walmart’s Journey to a Better Future (Walmart)
This week Wal-Mart committed to zero emissions by 2040 and reserving 50 million acres of land and 1 million square miles of ocean by 2030. [Link]
Read Bespoke’s most actionable market research by joining Bespoke Premium today! Get started here.
Have a great weekend!
Daily Sector Snapshot — 9/25/20
The Bespoke Report — Equity Market Pros and Cons: Q4 2020
This week’s Bespoke Report is an updated version of our “Pros and Cons” edition as we get set for the fourth quarter of 2020.
With this report, you’re able to get a complete picture of the bull and bear case for US stocks right now. It’s heavy on graphics and light on text, but we let the charts and tables do the talking!
On page two of the report, you’ll see a full list of the pros and cons that we lay out. Each bullet point is not meant to be weighted equally, but the fact that there are more cons than pros indicates that the market is entering Q4 facing plenty of headwinds instead of having the wind at its back.
To read this report and access everything else Bespoke’s research platform has to offer, start a two-week free trial to Bespoke Premium. Enter “THINKBIG” at checkout to receive a 10% discount once the trial ends. You won’t be disappointed!

