The Bespoke 50 Top Growth Stocks — 1/21/21
Every Thursday, Bespoke publishes its “Bespoke 50” list of top growth stocks in the Russell 3,000. Our “Bespoke 50” portfolio is made up of the 50 stocks that fit a proprietary growth screen that we created a number of years ago. Since inception in early 2012, the “Bespoke 50” is up 461.3% excluding dividends, commissions, or fees. Over the same period, the S&P 500 is up in price by 178.7%. Always remember, though, that past performance is no guarantee of future returns. To view our “Bespoke 50” list of top growth stocks, please start a two-week free trial to either Bespoke Premium or Bespoke Institutional.

Bespoke’s Morning Lineup – 1/21/21 – Strong Economic Data
See what’s driving market performance around the world in today’s Morning Lineup. Bespoke’s Morning Lineup is the best way to start your trading day. Read it now by starting a two-week free trial to Bespoke Premium. CLICK HERE to learn more and start your free trial.
“A plan without action isn’t a plan, it’s a speech.” – T. Boone Pickens
Futures are trading higher heading into the opening bell this morning on what is still another relatively light morning for earnings data. The economic calendar was on the busy side this morning as Jobless Claims, Housing Starts, and the Philly Fed Manufacturing report were all just released and they ALL came in better than expected.
Be sure to check out today’s Morning Lineup for updates on the latest market news and events, Korean export data, an update on the latest national and international COVID trends, and much more.

Equities had a big day yesterday with the S&P 500 up over 1% and the Nasdaq higher by close to 2%. One notable area of weakness, though, was in semiconductors. In a divergence you don’t see very often, despite the broader market gains, the Philadelphia Semiconductor Index (SOX) finished the day down marginally. This type of divergence is so uncommon in fact that you have to go all the way back to October 2007 to find the last time the SOX was down on a day when the Nasdaq was up over 1.5%.

Daily Sector Snapshot — 1/20/21
Homebuilder Sentiment Disappoints
The NAHB’s reading on homebuilder confidence was expected to go unchanged at a very strong reading of 86 in January. Instead, the NAHB’s headline index fell down to a reading of 83. Although that is lower, it remains well above any pre-pandemic reading. In other words, homebuilders are less confident than they have been in the past couple of months but sentiment remains overwhelmingly positive.

Even after falling two months in a row, the overall market index and most of its sub-indices remain near record highs. As for the regional indices, there is a bit more variation. The index for the Northeast has seen the sharpest decline falling 10 points in January. That is tied with August of 2018 for the seventh-largest month over month decline on record. While still in the top decile of historical readings, it is far lower than the other regions. On the other hand, albeit lower, the Midwest and the West are the two regions that remain at the highest ends of their historical ranges.


With earnings season underway, the next month will see the vast majority of the S&P 1500 homebuilder stocks report earnings. The snapshot below is from our Custom Portolfios tool. This should give more color to the overall picture for homebuilders. As for the companies reporting, only one, MDC Holdings (MDC) has averaged a full day decline in response to earnings. Additionally, historic beat rates are generally pretty strong across the board. Click here to view Bespoke’s premium membership options for our best research available.

New Highs for Purchase Applications
One of the few economic data points released today was weekly mortgage applications from the Mortgage Bankers Association (MBA), and the data was positive. Seasonally adjusted purchases rose 2.7% week over week to the highest level since the last week of November of 2008. That eclipses the previous high of the cycle from late November of last year.
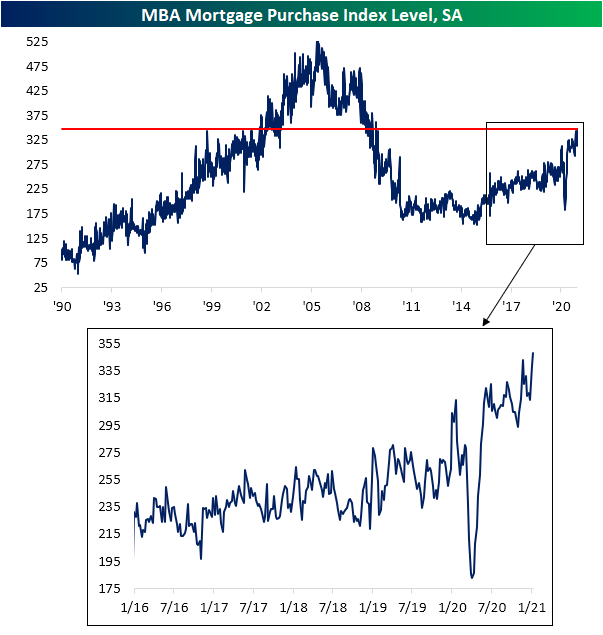
On an unadjusted basis, the average level of mortgage purchase applications is off to its strongest start to a year (through the first three weeks) since 2008. As shown in the second chart below, the seasonal bottom for purchase applications typically occurs at end of each year. With that now in the rearview, purchases have been following the seasonal trend higher. This increase typically lasts throughout the rest of winter and peaks in the spring (usually in late April/early May as indicated by the blue dots). So far in 2021, purchase applications are not only following that seasonal pattern but are also running at a stronger pace than other years of the past decade.


While purchase applications were stronger, refinance activity took a step back in the most recent week. The Refinance index dropped 4.72% week over week. Although that is lower, outside of last week it is still at some of the highest levels since last March’s spike higher. That is also around levels not seen since the spring of 2013.

In terms of related stocks’ reaction to this data, initially this morning, that stronger reading in mortgage purchases led mortgage REITS as proxied by the iShares Mortgage Real Estate ETF (REM) to nearly break out from the past couple of month’s range. but the rally was stopped in its tracks by the release of the weaker than expected homebuilder sentiment reading from the NAHB. Meanwhile, perhaps a bit ironically, the S&P Homebuilders (XHB) have continued to rally, rising 2.37% to a new 52-week high.Click here to view Bespoke’s premium membership options for our best research available.


Presidential First Days
It’s Inauguration Day, and so far equities are welcoming in the new administration with a gain of more than 1% for the S&P 500 (SPY). As to how that compares to the first day of past presidencies, in the chart below, we show intraday performance on Inauguration Day since the start of Reagan’s second term in the mid-1980s when our intraday data begins. Excluded are the inaugurations for George W. Bush’s first term and Obama’s second term considering these fell on days that the market was closed; a Saturday in the case of the former and MLK day for the latter.
The second inauguration for Ronald Reagan was met with the strongest performance for the S&P 500 as the index steadily drifted higher throughout the day to rise 2.28% by the close. With the S&P 500 up over 1% today, it is on pace for the best Inauguration Day performance since then. On average across all of these days, the S&P 500 has typically traded lower throughout the session with a leg lower in the early morning and another towards the end of the day (second chart). Breaking performance down by political party, inaugurations for Republican administrations have averaged a move higher with a bit of a dip midday while performance during inaugurations of Democrats has been weaker. Much of this weakness, however, is due to Obama’s first inauguration which came during the throes of the financial crisis.


As for the ushering in of a new administration or four more years of the same, performance has also tended to be quite different. As shown below, a president’s first inauguration over the past few decades has resulted in the S&P 500 dropping an average of 1.36% by the end of the day as the index steadily trades lower throughout the session. Again, much of this weakness can be attributed to the sharp decline on the day of Obama’s first inauguration. Conversely, the second inauguration of a president has seen the S&P 500 steadily trade higher. Click here to view Bespoke’s premium membership options for our best research available.

Chart of the Day: Consistent Q4 Earnings Season Winners
B.I.G. Tips – Charts We’re Watching
Bespoke’s Morning Lineup – 1/20/21 – Transition
See what’s driving market performance around the world in today’s Morning Lineup. Bespoke’s Morning Lineup is the best way to start your trading day. Read it now by starting a two-week free trial to Bespoke Premium. CLICK HERE to learn more and start your free trial.
“But every difference of opinion is not a difference of principle. We have called by different names brethren of the same principle. We are all Republicans, we are all Federalists.” – Thomas Jefferson
After reporting better than expected subscriber growth and announcing it would consider stock buybacks, Netflix (NFLX) looks like it will fittingly be the first blockbuster earnings report of the Q4 reporting season as the stock is trading up over 13%. That gain has Nasdaq futures trading up nearly 1% while the S&P 500 and Dow futures are positive but not by nearly as much. In other earnings news this morning, all nine of the companies reporting have topped EPS forecasts while seven out of nine have also topped revenue forecasts. Two companies (ASML and Procter & Gamble) even raised guidance.
Economic data this morning is relatively light as the only notable report on the calendar is homebuilder sentiment at 10 AM. Economists are forecasting the headline index to remain unchanged at last month’s reading of 86. The big event of the day will obviously be the inauguration of Joe Biden as the 46th President of the United States at noon eastern time and the flurry of Executive Orders concerning student loans, eviction moratoriums, the Keystone Pipeline, the travel ban, and mask-wearing on Federal property that are expected to immediately follow.
Be sure to check out today’s Morning Lineup for updates on the latest market news and events, Chinese Industrial Production, an update on the latest national and international COVID trends (which were positive again), and much more.
Today makes it official for Joe Biden as he will be sworn in as the 46th President of the United States. With that in mind, the table below summarizes the performance of the DJIA for every US President since 1900. In terms of gross percentages, the DJIA’s 56.0% gain under Donald Trump’s tenure ranks as the 8th best out of the 20 shown. While that performance seems pretty middle of the road, all seven of the Presidents that oversaw larger gains did so over more than one full-term. To account for each President’s time in office, in the rightmost column, we show the DJIA’s performance on an annualized basis, and on this basis, the 11.8% gain during the Trump Administration ranks as the fourth-best behind Coolidge (25.5%), Clinton (15.9%), and Obama (12.1%).
We all remember the big market rally we saw after the 2016 election with Trump’s election when the S&P 500 rallied more than 6%. As impressive as that gain was, it pales in comparison to the current period where the S&P 500 is up nearly 12% since the election.

Turning our attention back to Netflix (NFLX), with the stock set to gap up over 13%, today will be the largest upside gap for the stock since October 2016 and the 14th upside gap of 10%+ for the stock since 2010. In the table below, we summarize each of the prior instances along with how the stock performed from the open to close. NFLX has continued higher over three-quarters of the time with an average gain of 1.05% (median: 1.84%). Also notable is the fact that all but one of the stock’s prior upside gaps was an earnings-related move. The only exception was in August 2015 during the volatility of the China yuan devaluation. That was also the time the stock saw the largest downside move from the open to close.
