Chart of the Day – VIX Fixed Above 20
Bespoke’s Morning Lineup – 1/28/21 – Differing Options
See what’s driving market performance around the world in today’s Morning Lineup. Bespoke’s Morning Lineup is the best way to start your trading day. Read it now by starting a two-week free trial to Bespoke Premium. CLICK HERE to learn more and start your free trial.
“There is nothing new in Wall Street. There can’t be because speculation is as old as the hills. Whatever happens in the stock market to-day has happened before and will happen again.” – Edwin Lefevre, Reminiscences of a Stock Operator
After some of the individual stock moves we have seen in the last few days and continue to see this morning, it seems odd to see futures for the S&P 500 only modestly lower. The pace of earnings season has really started to pick up steam in the last 24 hours, and the next 24 hours will be busy as well. So far, companies have been reporting strong results, but given the run-ups we’ve seen in stocks leading up to the reporting period and the high level of expectations, it’s not too surprising to see investors selling the news.
As if all the earnings news wasn’t’ enough to deal with, there’s also a tone of economic date to navigate through over the next two days as well, including today’s releases of Jobless Claims, Q4 GDP, Leading Indicators, New Home Sales, and the KC Fed report.
Be sure to check out today’s Morning Lineup for updates on the latest market news and events, earnings reports from around the world, Economic data out of Europe, an update on the latest national and international COVID trends, and much more.

Yesterday was an interesting day in the market. Interesting may be an understatement, but our point is that while the S&P 500 was down just over 2.5%, the upward move in the VIX was suggestive of a much larger downside move. The VIX’s massive upside move of 14.2 points Wednesday was the 17th day in the index’s history that it jumped ten or more points in a single day. On those days, the S&P 500’s average decline was 6.27% (median: 5.89%). Of those 17 days, yesterday’s 2.57% decline ranks as the smallest decline of them all. Even on the days where the VIX rose by less than it did yesterday but was still up more than 10 points, the S&P 500’s median decline was 5.28%. The smallest one-day decline of those days was -3.5% – nearly a full percentage point more than Wednesday’s decline. Based on the S&P 500’s performance on prior days where the VIX had a large one-day increase, yesterday there was a disconnect between sentiment in the market and the options market.

Daily Sector Snapshot — 1/27/21
Chart of the Day – More of the Same: Shorts Lead the Market
And Then There Were Four
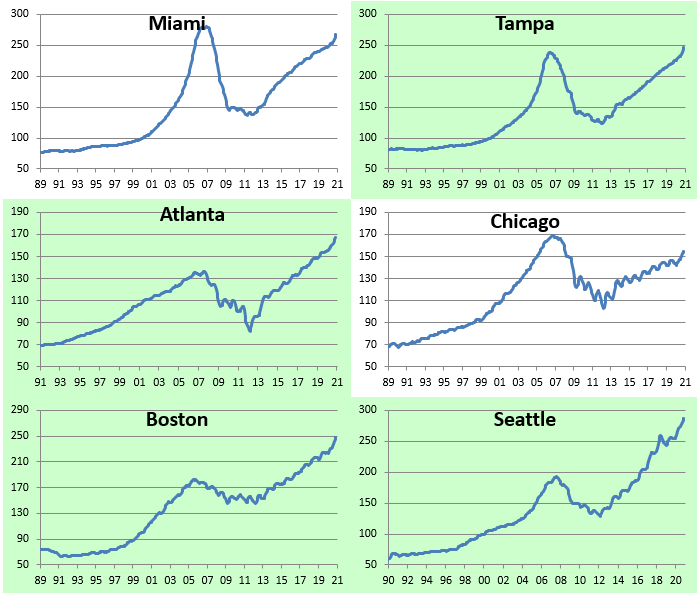
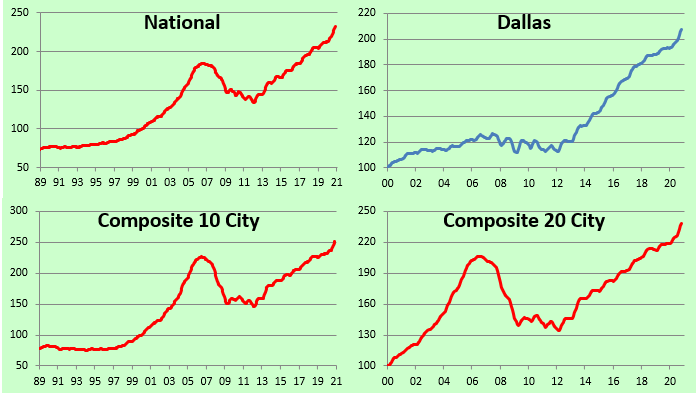
S&P/Case-Shiller home price figures for November 2020 were released on Tuesday, and below are the details. Month-over-month, every single city saw home-price gains, with New York and Boston gaining the most. Chicago and Cleveland saw the smallest MoM gains. On a year-over-year basis, every city is up at least 7%, with Phoenix, San Diego, and Seattle prices up the most. Click here to view Bespoke’s premium membership options for our best research available.

Below is an updated look at where home prices stand relative to their mid-2000s housing bubble peaks. Three cities saw home prices break above their prior highs in November — Tampa, DC, and New York. There are now only four cities that remain in the red versus their housing-bubble highs — Phoenix, Miami, Chicago, and Las Vegas.

Below are historical home price charts for the various cities and composite indices tracked by S&P/Case-Shiller. Cities in green are at new all-time highs. Yes, there’s now a lot of green!


B.I.G. Tips – Mega Cap Earnings Out Tonight
Bespoke’s Morning Lineup – 1/27/21 – Game Time
See what’s driving market performance around the world in today’s Morning Lineup. Bespoke’s Morning Lineup is the best way to start your trading day. Read it now by starting a two-week free trial to Bespoke Premium. CLICK HERE to learn more and start your free trial.
“Beware of false knowledge; it is more dangerous than ignorance.” – George Bernard Shaw
Shares of GameStop (GME) are trading up over 50% in the pre-market, and while that may sound ludicrous, earlier this morning they were up well over 100%! The pre-market rally lin GME lost its steam following a CNBC report that Melvin Capital completely exited its short position on Tuesday afternoon. The crying uncle of one of the most notable shorts on GME would presumably mark the peak of this surge, but then again, no one would have really predicted that things would have gone this far to begin with. It’s interesting to note that much of the moves in GME have been driven by options trading, so when those markets open at 9:30 things could get a lot more interesting.
From GME, where will things go next? Was this just a one-shot deal, or will the traders that originally targeted GME move on to other targets? From a broader market perspective, though, it’s hard to look at what’s going on in the market right now and frame it as a positive. Also, keep in mind that today is an FOMC meeting day, and while there will likely be no changes to policy, we can guarantee that the subject of GME will come up in the 2:30 press conference.
Be sure to check out today’s Morning Lineup for updates on the latest market news and events, earnings reports from around the world, Economic data out of Europe and Asia, an update on the latest national and international COVID trends, and much more.
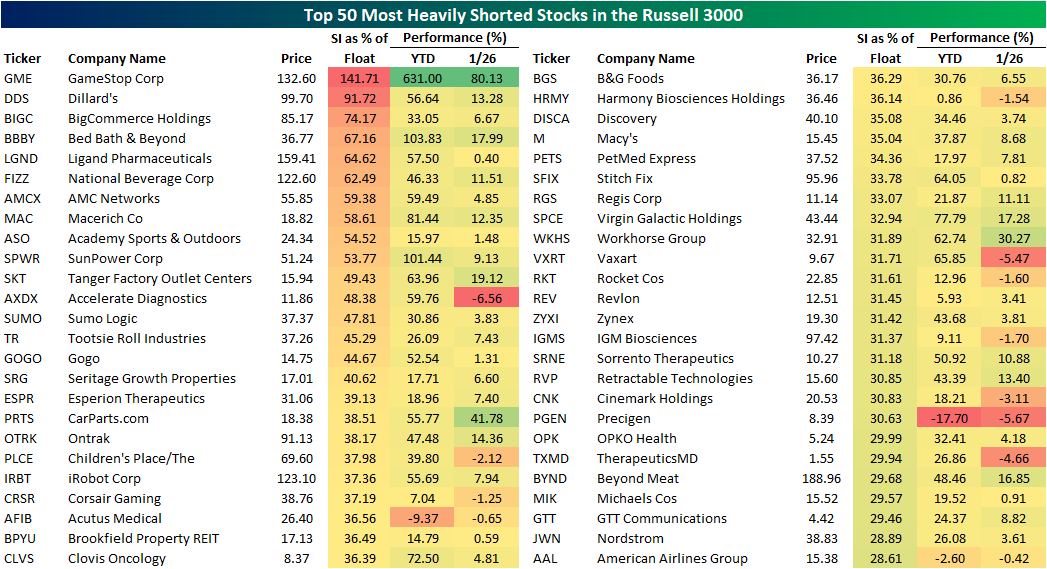
Yesterday, we showed a version of the table below showing the performance of the most heavily shorted Russell 300 stocks as of the end of 2020. As we noted, heading into yesterday’s session GME was up an incredible 307%. The other stocks were also doing well with every single one of them up at least 10% and half of them up over 50%. Since we published that list, the performance of these stocks has only gone much higher. Through yesterday’s close, the 16 stocks listed below are up an average of 96% while the median gain is still an incredible 58%. Along with GME, Bed Bath and Beyond (BBBY) and SunPower (SPWR) have also doubled since the start of the year.

Daily Sector Snapshot — 1/26/21
Most Shorted Stocks Towering Over the Rest
GameStop (GME) and its historic short squeeze continues to be the talk of the town today with the stock up better than 90% as of this writing. But as we noted multiple times recently including in last night’s Closer, more broadly stocks with high short interest have been massive outperformers. Breaking down the Russell 3,000 into deciles (10 groups of ~300 stocks each) based on their short interest as a percentage of equity float, the comparison of the most shorted stocks to the rest is stark. The decile of the most shorted stocks is the only one in the green today with an average gain of more than 2%. That compares to an average loss of 0.51% for the other deciles. Even excluding GME, that average gain is 1.95%.
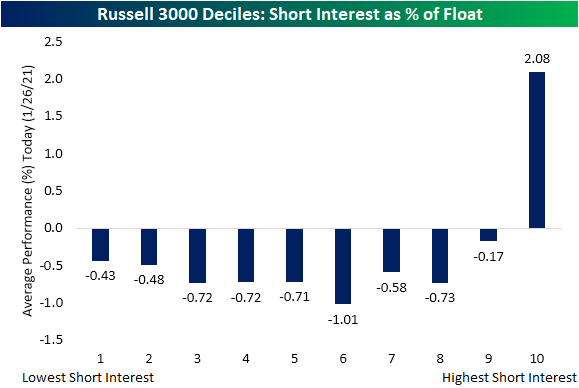
The contrast is just as stark on a year-to-date basis. While every decile is up year to date, the group of the most heavily shorted stocks has risen 26.88% on average while the stocks in the decile of least shorted stocks is up just 2.84%.

In the table below, we show the 50 Russell 3,000 stocks with the highest short interest as a percent of float. Other than GME, Bed Bath & Beyond (BBBY) and SunPower (SPWR) have also more than doubled this year. Of the 50 most shorted stocks, only American Airlines (AAL), Precigen (PGEN), and Acutus Medical (AFIB) are down YTD. Each of these is also lower in trading today. Click here to view Bespoke’s premium membership options for our best research available.
Price to Sales Surge
The price to sales ratio is a valuation metric that is calculated by dividing market cap by annual sales. In a normal market environment, a company with a lower price to sales ratio looks more attractive than a company with a higher price to sales ratio. Based on the price action we’ve seen recently, however, this is not a normal market environment! Lately, the higher the price to sales ratio, the higher the share-price return.
Looking at the S&P 500 as a whole, the index’s current price to sales ratio is just under 3 at 2.89. That’s about 75% above the S&P’s average price to sales ratio of 1.65 seen since 1995. The S&P 500 Technology sector’s price to sales ratio has climbed to 7.03. That’s more than double the average price to sales ratio of 3.12 of the Tech sector since 1995.
As shown below, the S&P 500’s price to sales ratio is currently solidly above the peak reading it saw in March 2000 at the top of the Dot Com boom. The Technology sector’s price to sales ratio has not quite made it to its Dot Com peak of 7.87, but it’s getting close. Click here to view Bespoke’s premium membership options for our best research available.
