Another Big Beat in Regional Fed Data
Just like last week’s release of the Empire Fed Manufacturing report, this morning’s reading on the manufacturing sector from of the Dallas Fed saw a much stronger than expected reading. Rather than the forecasted reading of 5, today’s release more than tripled those estimates coming in at 17.2. Since at least 2009, that is the fifth biggest beat relative to forecasts on record. The last time the Dallas Fed report’s headline reading exceeded expectations by this much or more was back in June, coming out of the depths of lockdowns. That reading of 17.2 indicates the region’s manufacturing sector not only grew for a seventh consecutive month but also accelerated in February. Meanwhile, firms remain optimistic for their future as the future outlook index rose to the highest level since October of 2018.

Breadth in this month’s report was broadly positive though there were some areas of weakness. For the current conditions indices, every category with the exception of Inventories continued to show expansionary readings. Alongside inventories, only those categories concerning employment saw lower month-over-month readings. Additionally, the index for uncertainty experienced a sizeable 10.8 point decline.
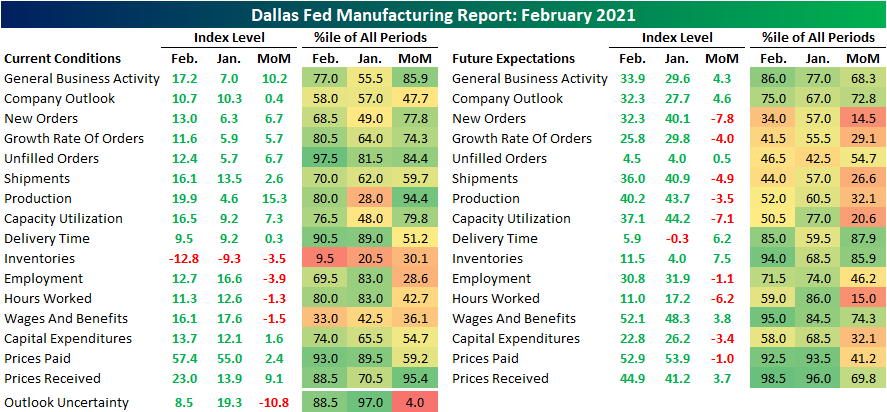
Again, most indices in the table above did move higher in February including all of those concerning demand. Indices for things like New Orders, the New Order Growth Rate, Shipments, Capacity Utilization, and Production were all higher in February though they remain off their peaks from several months ago. One exception though is for Unfilled Orders. That index more than doubled rising to 12.4 which is the highest level since July of 2018. That is also in the top 2.5% of all readings throughout the history of the survey dating back to 2004. Altogether, this means that orders came in at a more rapid pace in February leading order backlogs to grow at a historically strong rate.

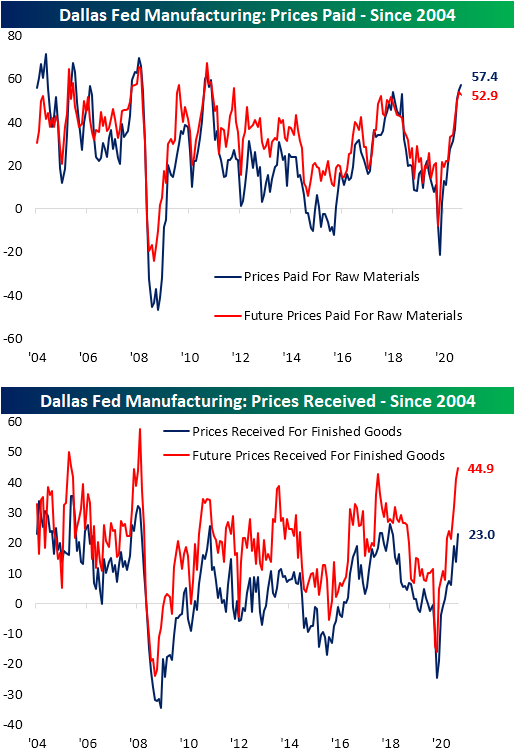
Consistent with other readings on the manufacturing sector of late, the Dallas Fed’s report showed both prices paid and received are accelerating. Starting with the former, the index for Prices Paid rose another 2.4 points to 57.4. That is the seventh straight month over month increase for that index; a new record for most consecutive months with higher readings taking the index to its highest level in nearly a decade.
While Prices Received are also on the rise with that index moving up to a reading of 23, they are not as historically elevated with the February number only the highest level since June of 2018. Granted, expectations would point to Prices Received more closely resembling Prices Paid at some point down the road. The index for future Prices Received rose to 44.9 which is the fourth highest reading on record behind September and October of 2005 and July of 2008.
As previously mentioned, perhaps the weakest area of the report this month concerns employment. Most of these indices continue to indicate further employment growth in terms of the Number of Employees, Hours Worked, and Wages & Benefits, but the pace of improvement decelerated in February. While current readings on Wages and Benefits saw slower growth, though, expectations are far more elevated. That index rose to 52.1 which is in the top 5% of all readings in the history of the index. Click here to view Bespoke’s premium membership options for our best research available.

Best and Worst S&P 500 Stocks So Far in 2021
In the table below, we show the 30 best-performing stocks in the S&P 500 so far in 2021. Of the entire index, the two best-performing stocks come from the Communication Services sector and both have gained more than 70%. Discovery (DISCK) tops the list with a gain of 73.4% while ViacomCBS (VIAC) has surged 72.2%. Moving down the list, the next two best performers have been a couple of energy names with gains of more than 50%: Occidental Petroleum (OXY) and Marathon Oil (MRO). While they find themselves at the top of the list, they are far from alone. Of the 30 best performers, a third (including OXY and MRO) are from the Energy sector.
One interesting thing to note of these names, while they have seen some of the strongest performance so far in 2021 and have nearly all more than doubled since the bear market lows last year, not a single one has yet to move back above levels they traded at when the S&P 500 peaked just before the COVID crash. Some are close, though, with Marathon Oil (MRO), Devon Energy (DVN), and Marathon Petroleum (MPC) all low-single-digit percentage points away from those levels. Additionally, absent from the list of the best-performing stocks are mega-cap names. In fact, of the top 30 best performers YTD, only two—Exxon Mobil (XOM) and Applied Materials (AMAT)—rank in the top 100 largest stocks in the S&P 500 in terms of market cap. Conversely, 12 rank in the bottom 100 stocks in the S&P 500.

Flipping over to the worst-performing stocks in the S&P 500 this year, there are 17 stocks that have now fallen double digits. DaVita (DVA) is down the most of these with a decline of over 15%. Similar to the Energy sector’s representation among the best performers, Health Care is the most prevalent sector among the worst performers; DVA being one of these. Additionally, the pattern of stocks with smaller market caps outperforming is evident in the worst performers in the S&P 500. The 30 best-performing stocks average a market cap of $34.68 billion while the worst performers average a market cap of $56.87 billion. Five of these worst-performing stocks rank in the top 100 largest stocks in the index while only four fall within the ranks of the smallest 100 S&P 500 stocks. Click here to view Bespoke’s premium membership options for our best research available.

Chart of the Day – Leading Indicators Leave Recession Behind
Mega Cap Tech Dragging Its Feet While Social Media Surges
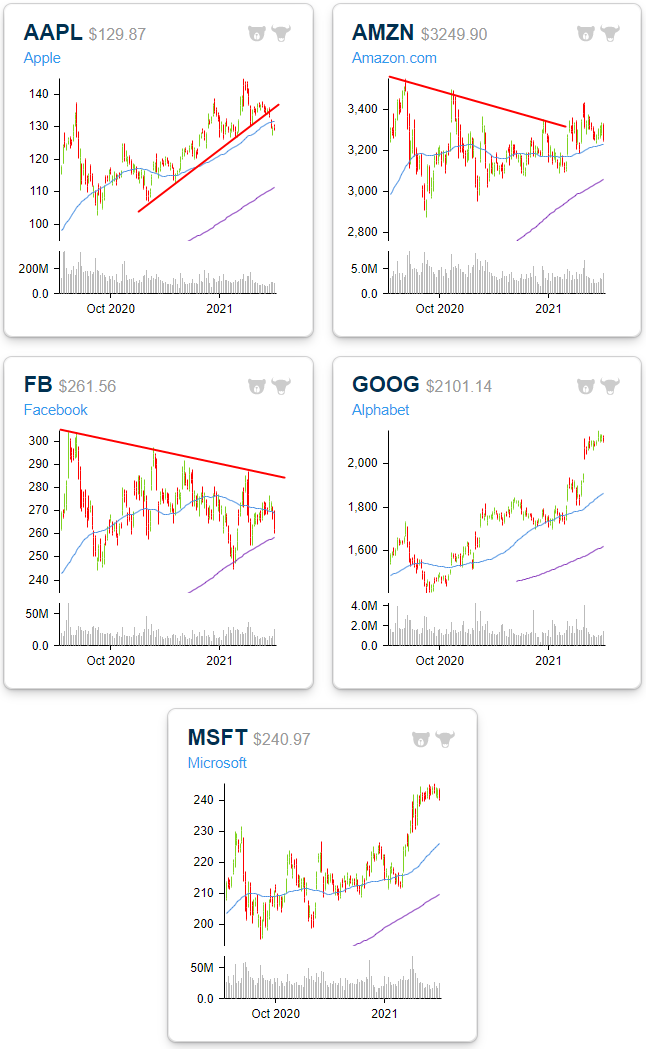
This year’s underperformance of the mega-cap stocks can be seen in the table and charts below. First, in the snapshot from our Trend Analyzer of the five largest companies in the S&P 500 we can see that three of the five are underperforming the S&P 500 YTD and only Alphabet (GOOG) is significantly outperforming.

As shown in the snapshot of our Chart Scanner below, last week, Apple (AAPL) traded and closed below its 50-day moving average for the first time since November and broke its uptrend that had been in place over that time in the process. Amazon.com (AMZN), meanwhile, hasn’t made a new high since 9/2 as it consolidates the massive rally off the March lows. Following the consolidation of the last five months, the stock is starting to look more attractive from a technical perspective. Like AMZN, Facebook (FB) hasn’t made a new high since last September either, but unlike AMZN which has been forming a solid base, FB’s pattern looks more like a downtrend. Alphabet (GOOG) and Microsoft (MSFT) are the only two of the mega-caps that have outperformed YTD, but at this point, they’re extremely extended.
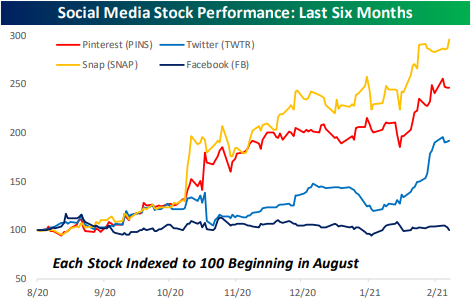
With Facebook performing so poorly—some of the reasons for which we discussed in Friday’s Bespoke Report—one would think that social media stocks have been out of favor. The reality, though, is that nothing could be further from the truth. The chart below shows the performance of the four major social media stocks over the last six months with each stock indexed to 100. While FB is unchanged during that span, Twitter (TWTR) is up 91%, Pinterest (PINS) is up 150%, and Snap (SNAP) has nearly tripled! Click here to view Bespoke’s premium membership options for our best research available.
Aussies and the US Lead in Global Yield Curve Steepening
As global COVID curves are flattening, global yield curves have been steepening in a sign that investors are pricing in a much better economic environment. The chart below shows the pattern of the 2s10s yield curve for the US, Australia, the UK, Germany, and Japan since the start of 2020. While all five of them were at similar levels prior to the outbreak of the pandemic, their paths since then have varied widely with the US and Australia seeing the greatest steepening, while the steepness of the three remaining curves has been considerably flatter. Since the outbreak of the pandemic, Australia has been generally thought of as having the strictest response to COVID while the US has been derided for taking the least amount of precautions. Despite the vastly different approaches by both countries, their yield curves have followed nearly identical paths and judging by the slope of their yield curves, the market is anticipating robust economic growth from both countries.
In fact, as we mentioned in today’s Morning Lineup, the 10-year yields of both countries are reaching new 52 week highs today. In the case of Australia, whose 10-year yield rose 17 bps to start the week, the single day steepening of the 2s10s curve today was the biggest since March 17th and 18th of last year. For the US yield curve, it was the second period since the COVID outbreak where the 2s10s yield curve steepened by more than 50 bps over a six-month period. In Friday’s Bespoke Report, we covered what that has historically meant for equity market performance. Click here to view Bespoke’s premium membership options for our best research available.

Bespoke’s Morning Lineup – 2/22/21 – 52-Week Highs…In Treasury Yields
See what’s driving market performance around the world in today’s Morning Lineup. Bespoke’s Morning Lineup is the best way to start your trading day. Read it now by starting a two-week free trial to Bespoke Premium. CLICK HERE to learn more and start your free trial.
“The stock market is filled with individuals who know the price of everything, but the value of nothing.” – Phillip Fisher
It’s looking like it’s going to be one of those Mondays this morning. Treasuries are trading higher this morning while equities are looking to open moderately lower. Bitcoin, meanwhile, is down over 8% after Elon Musk said over the weekend that prices ‘seem high’. That’s enough these days.
In economic news, the only two datapoints on the calendar this morning are Leading Indicators at 10 AM and Dallas Fed at 10:30 AM. Earnings season is unofficially over, but there’s still a number of key reports to contend with after the close and over the next few days. Make sure to track them all in our Earnings Calendar.
Be sure to check out today’s Morning Lineup for updates on the latest market news and events, earnings reports from around the world, economic data from around the world, an update on the latest national and international COVID trends, and much more.

As the pre-pandemic days start to fall further in the past, one-year charts of various financial assets are starting to look a lot more different. Take the yield on the 10-year US Treasury. Along with the fact that yields are rising, the higher levels of rates from before the pandemic are falling out of the one-year window. Through that combination of events, today’s yield of 1.3721% would mark a 52-week high on a closing basis. It’s been a while since we’ve been able to say that! As if the chart doesn’t look interesting enough now, wait until late March when the down leg falls completely out of the picture.

Bespoke Brunch Reads: 2/21/21
Welcome to Bespoke Brunch Reads — a linkfest of the favorite things we read over the past week. The links are mostly market related, but there are some other interesting subjects covered as well. We hope you enjoy the food for thought as a supplement to the research we provide you during the week.
While you’re here, join Bespoke Premium with a 30-day free trial!
Retirement
American Workplace Retirement Savings Accounts Hit New Records by Suzanne Woolley (Bloomberg)
Retirement savings hit the highest total on record, with the average 401(k) gaining 11% to $121,500 per new Fidelity data. Both strong contributions (totaling 13.5% of income) and the robust equity market gains of late 2020 helped push balances higher. [Link; soft paywall]
Goldman Sachs to Offer Its Investing Know-How to the Masses by Peter Rudegeair (WSJ)
In a bid to goose growth of its Marcus platform, Goldman has unveiled Marcus Invest, a roboadviser that automatically rebalances portfolios and allocates between various asset classes based on the broader bank’s investment strategy committee’s models. [Link; paywall]
At 93, She Waged War on JPMorgan—and Her Own Grandsons by Tom Schoenberg (Bloomberg)
When a wealthy Florida retiree discovered her grandsons had been abusing her trust as they managed her wealth through JP Morgan, she decided to teach them and the bank a lesson. [Link; soft paywall]
Getting Bubbly
The Man Who Abandoned Value by Michelle Celarier (Institutional Investor)
Fascinating insights from a neurodivergent hedge fund manager who realized over a decade ago that the traditional value approach just wasn’t going to work anymore, and who is part of a larger trend that has abandoned the “value” approach. [Link]
Hedge fund seeks to hire Reddit options trader fluent in memes: ‘No higher education in economics or finance’ by William Canny (Financial News)
In a bid to keep track of retail trader interest, a quant hedge fund is looking to hire someone who can keep track of what’s being said about stocks on Reddit, Twitter, and other social platforms. [Link; paywall]
Non-Traditional Markets
‘There’s never been a time like this’: Wall Street is piling into trading cards as prices soar by Julia Horowitz (CNN)
Explosive price appreciation in trading cards has both drawn in and been driven by the advent of institutional interest in the space. [Link]
Kevin Durant and Logan Paul Agree: Sports Trading Cards Are the Future by Lucas Shaw (Bloomberg)
An LA-based sports memorabilia company has raised $40mm in an effort to expand its hold on the rarest and most sought-after playing cards. [Link; soft paywall]
Online-Trading Platform Will Let Investors Bet on Yes-or-No Questions by Alexander Osipovich (WSJ)
A new prediction platform that offers binary wagers on real world events with backing from Sequoia and Charles Schwab is launching next year, hoping to cash in on a massive wave of interest in stock market speculation and sports gambling. [Link; paywall]
COVID
COVID-19 Cases Are Dropping Fast. Why? by Derek Thompson (The Atlantic)
A spiraling surge in COVID cases over the holidays led to predictions of catastrophic caseloads, but a combination of behavioral changes, seasonal shifts, partial immunity, and vaccines are combining to cap the growth of cases. [Link]
School Reopening Pits Parents Against Teachers: “Is There a Word Beyond ‘Frustrating’?” by Kris Maher and Jennifer Calfas (WSJ)
The reopening debate is just the latest sign of political polarization in the United States, with different interest groups (splits among parents, and teachers concerned over safety) fighting to dictate the policy path for school reopening as cases recede. [Link; paywall]
Renewables
Frozen Wind Farms Are Just a Small Piece of Texas’s Power Woes by Will Wade, Naureen S. Malik, and Brian Eckhouse (Bloomberg)
While Texas wind turbines did encounter difficulties operating in extremely low temperatures, the failure of traditional power resources has been far more significant, with larger drop-offs relative to expectations and more difficulty returning to service than the forests of wind turbines the state has built. [Link; soft paywall]
Crypto
MicroStrategy Announces Proposed Private Offering of $600 Million of Convertible Senior Notes (MicroStrategy)
This week a company funded bitcoin speculation with the issuance of 6 year convertible notes, a leveraged bet that is relatively unique even in the hyped world of cryptocurrency. [Link]
Sports
Hockey Has a Gigantic-Goalie Problem by Ken Dryden (The Atlantic)
Tracing the history of ever-larger goalie equipment, which has allowed keepers to steadily shrink the percentage of the net that is exposed to sharpshooters. [Link; soft paywall]
The Padres Owe Fernando Tatís Jr. $340 Million. He Owes an Investment Fund Millions From His Payday. by Jared Diamond (WSJ)
Big League Advance offers cash up front to minor leaguers, who then have to fork over a chunk of their earnings if they make it big. For a 14 year contract, that number can get pretty big indeed. [Link; paywall]
Read Bespoke’s most actionable market research by joining Bespoke Premium today! Get started here.
Have a great weekend!
The Bespoke Report – 2/19/21 – “What a Long Strange Trip It’s Been”
This week’s Bespoke Report newsletter is now available for members.

To read the report and access everything else Bespoke’s research platform has to offer, start a two-week free trial to one of our three membership levels. You won’t be disappointed!

Industrial Metals Shining Bright
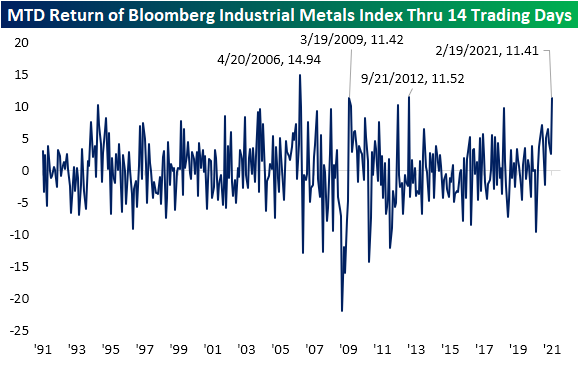
While precious metals like gold have been facing their fair share of selling recently alongside rates, elsewhere in the metals markets, industrial metals have been surging. Year to date, industrial metals—as proxied by the Bloomberg Industrial Metals total return index—are up 11.43% while their precious metals counterpart is down by over 4%. With a fairly flat January, most of those gains have come from this month alone. As shown below, so far this month the Bloomberg Industrial Metals index has risen 11.41% for its strongest performance through the first 14 trading days of a month since September of 2012. Going back to the start of the index in early 1991, the only other months with stronger performance were March of 2008 (11.42) and April of 2006 (14.94).
Again, whereas industrial metals are flying, precious metals have been trending lower since the summer. In the chart below, we show the relative strength of the Bloomberg Industrial Metals index versus the precious metal counterpart index over the past five years. Times that the line is rising indicates outperformance of industrial metals and vice versa. Precious metals had been outperforming since mid-2018, but the relative strength line bottomed out back in August of last year. From then through the late fall, industrial metals outperformed, and after some consolidation from November through the end of January, industrials are once again outperforming in a big way.

Delving deeper, tin, copper, and nickel have been leading in those gains. As shown in the charts below, both year to date and over the past year, these three metals have risen the most with tin in the number one spot in both respects. Start a two-week free trial to Bespoke Premium to access our best investment research available.


Value Outperforming Growth But Only for Large Caps
While the S&P 500 traded lower today, value stocks had a strong finish to the week. Starting with a look at dividend stocks, the iShares Select Dividend ETF (DVY) rose 1.35% today for its best day since January 6th when DVY rose nearly 4%. As shown below, DVY has recently been on a tear.

Along with the dividend ETF (DVY), the iShares S&P 500 Value ETF (IVE) rose 0.31%, reaching a new 52-week high intraday. That compares to the growth counterpart, the iShares S&P 500 Growth ETF (IVW), which saw a bearish engulfing on its 0.65% decline. Today was the widest outperformance for value (IVE) over growth (IVW) since mid-January. As shown below, while both are still trending nicely higher long-term, the value ETF is at new highs while growth is closer to its 50-day moving average.

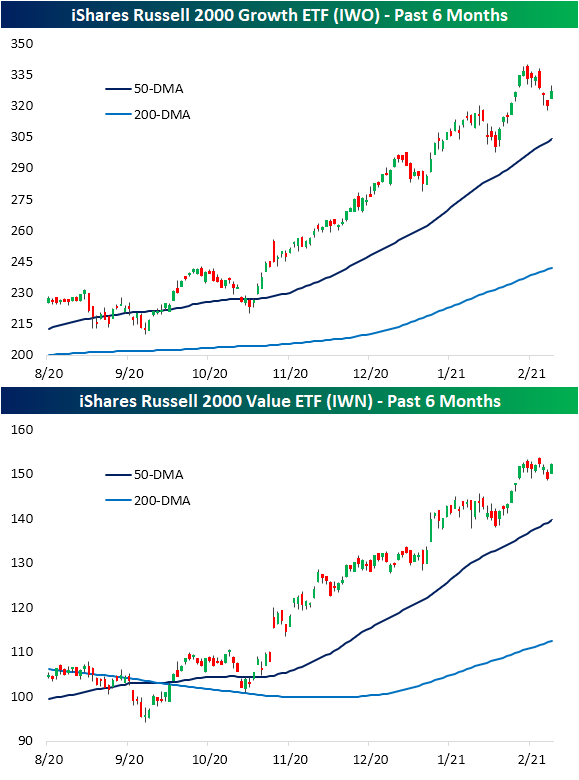
Value’s outperformance today only applied to large caps, though. While small caps have fallen over the past several sessions, the Russell 2000 Growth ETF (IWO) and Russell 2000 Value ETF (IWN) both rebounded nicely today with identical gains of 2.08%. In the case of small-cap growth (IWO), the recent declines have been more severe meaning today’s strong performance still leaves it further below its highs than small-cap value (IWN). Start a two-week free trial to Bespoke Premium to access our best research available.