Pfizer (PFE) Partying Like It’s 1999
Last August 31st, well before the first studies on the effectiveness of COVID vaccines were published, Pfizer (PFE) was removed from the vaunted Dow Jones Industrial Average. Due to its low share price and the fact that the Dow is a price-weighted index, the Dow’s decision-makers decided to remove Pfizer (PFE) instead of competitor Merck (MRK) and replace it with much higher-priced Amgen (AMGN).
Coincidentally (or not), Pfizer (PFE) has easily outpaced Dow members Merck (MRK) and Amgen (AMGN) since the changes were made to the index last August. While Pfizer (PFE) is up 26% since it was removed from the Dow, both Amgen (AMGN) and Merck (MRK) have acted as drags on the index with declines of 10% and 7%, respectively. There is a stark difference in the chart patterns of the three shown below. (AMGN fell 6.5% today which is not yet included on the chart.)

Even after the big run it has had since the vaccine news came out late last year, Pfizer (PFE) is remarkably still trading below its all-time high made in April 1999. There aren’t a lot of blue-chip stocks left that are still below their highs from the 1990s, but PFE is one of them. After today’s move, PFE now needs to gain just 3.69% to break out to a new all-time high. You can bet that “breakout” watchers will be salivating at this one given the multi-decade resistance level that’s in place.

While PFE’s share price is still below its 1999 all-time high, long-term shareholders should at least be happy that the company pays a solid dividend. In fact, even though PFE’s share price is down since its all-time high made in April 1999, the stock’s total return (with dividends reinvested) over this time frame is +103%, which translates into an annualized return of ~3.2%. The impact that dividends have on total returns for investors cannot be overstated, and PFE is a perfect example.
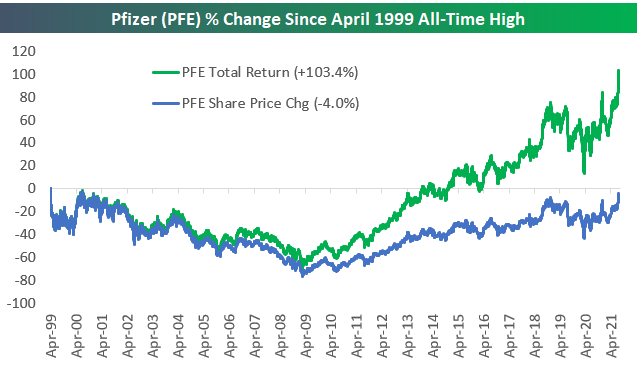
The difference in share price change and total returns is even more dramatic the further back you go. Since 1990, Pfizer’s price change has been solid at 1,523%, but its total return is 2.7x that at +4,075%. On an annualized basis, dividends reinvested add more than three percentage points to PFE’s move since 1990 (total return=12.5% vs. price change=9.2%). Click here to view Bespoke’s premium membership options.

Chart of the Day – ADP Misses By a Mile
Moderna’s (MRNA) Massive Market Cap
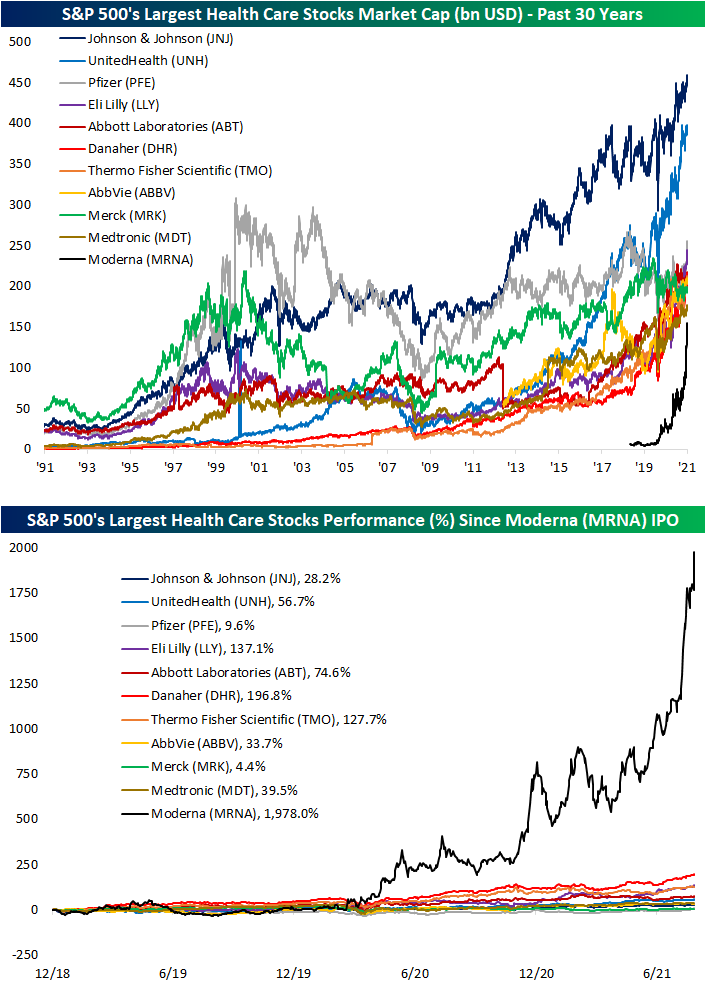
As could have been expected in the midst of a global pandemic, one of the most rapidly growing companies has been vaccine producer Moderna (MRNA). As shown below, since the start of the year, the company has seen its market cap nearly quadruple to $162.2 billion; that is the largest growth in market cap of any S&P 500 stock year to date. In fact, those big gains saw MRNA go from the 162nd largest S&P 500 stock at the end of last year to the 58th largest today. And that compares to pre-pandemic (the end of 2019) when MRNA was only valued at $6.52 billion. While it was not part of the index back then, MRNA would have been the eighth smallest S&P 500 stock at the time with that market cap. That massive growth now leaves the stock as the tenth-largest company of all S&P 500 Health Care stocks with the next largest being Medtronic (MTD). While there are a handful of larger stocks in the Health Care sector, again, no others have seen as rapid of growth. With that said, other vaccine-related stocks like Pfizer (PFE) and Johnson and Johnson (JNJ) have also seen significant market cap growth.

MRNA joined the upper echelon of Health Care market caps in a very short span of time. As shown in the second chart below, since its IPO in late 2018, MRNA has risen nearly 2,000%. Of the ten other largest S&P 500 Health Care stocks, the next best performer has been Danaher (DHR) with just under a 200% gain in that same span of time. Click here to view Bespoke’s premium membership options.
Bespoke’s Consumer Pulse Report — August 2021
Bespoke’s Morning Lineup – 8/4/21 – Jobs Stall
See what’s driving market performance around the world in today’s Morning Lineup. Bespoke’s Morning Lineup is the best way to start your trading day. Read it now by starting a two-week trial to Bespoke Premium. CLICK HERE to learn more and start your trial.
“The most important investment you can make is in yourself.” – Warren Buffett
The yield on the 10-year US Treasury continues to crater this morning following the much weaker than expected ADP Private Payrolls report. As of this writing, the yield is down to 1.14% which is a level that most investors probably thought they would never see again back in early April. Coming up at 10 AM, we’ll get the latest read on the Non Manufacturing sector from ISM. Contrasting the weaker than expected economic data, earnings news has been mostly positive but hasn’t been strong enough to push futures into positive territory.
Read today’s Morning Lineup for a recap of all the major market news and events from around the world, including a recap of SEC Chair Gensler’s comments related to crypto, the latest US and international COVID trends including our vaccination trackers, and much more.

Semiconductors have been trading in a range of a little over 20% for all of 2021, but as we noted in last week’s Bespoke Report, the group looked to be making a breakout attempt to close out the week. This week, that upside move appears to have been confirmed as the Semiconductor ETF (SMH) has traded further outside of its 2021 range. Going forward, look for the top of that former range to act as support in any pullback.

Daily Sector Snapshot — 8/3/21
Chart of the Day – REIT Occupancy Rates Recover
Bespoke Matrix Of Economic Indicators – 8/3/21
Our Matrix of Economic Indicators provides a concise summary analysis of the US economy’s momentum. We combine trends across the dozens and dozens of economic indicators in various categories like manufacturing, employment, housing, the consumer, and inflation to provide a directional overview of the economy.
To access our newest Matrix of Economic Indicators, start a two-week free trial to either Bespoke Premium or Bespoke Institutional now!
US Still Dominates Global Market Cap
On Friday, we highlighted some of the long-term charts and generally extended readings of the stock markets of various major global economies following big gains over the past year and a half. While equities around the globe have surged, it is still the US that has gained the most in terms of the percentage of world market cap. As shown below, according to Bloomberg’s market cap indices the US currently accounts for 43.17% of total global market cap. That is up 1.86 percentage points from the start of the year and is up roughly 4 percentage points since the bear market lows last year. As for the other largest countries, China is the only other one to account for a double-digit share at 10.15%, although, that is down significantly from the start of the year. Japan and Hong Kong are two others of the largest equity markets, and they have both lost even larger shares.
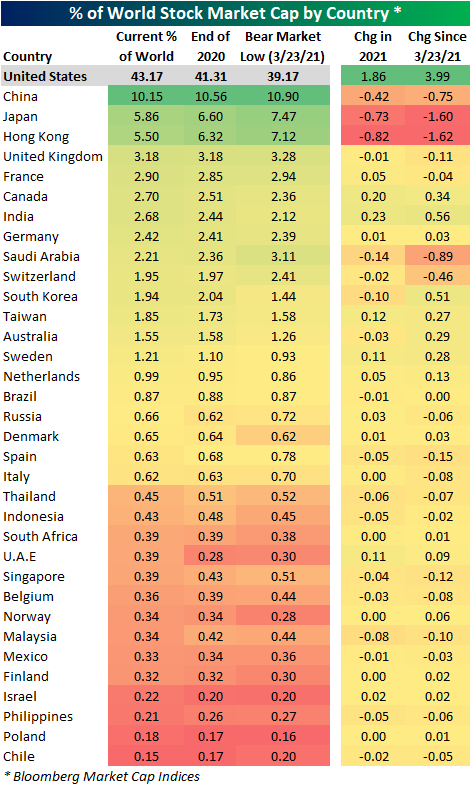
With US equities having continued to grow, the country’s share of world stock market cap is now around some of the highest levels since the fall of 2004. Those gains to the US’s share of global market cap are also in the context of a general upwards trend that has been in place for the better part of the past decade now.

For most of the year, Chinese and Hong Kong equities have traded off of their highs and more recently have fallen dramatically as a result of concerns surrounding the region’s regulatory picture. While the declines were quite dramatic, they have not necessarily brought the countries’ combined share of market cap to any sort of major new low. With that said, prior to the past week’s bounce, at the July 27th low, the one-month drop in the combined share of total market cap stood in the bottom 2% of all readings. Click here to view Bespoke’s premium membership options.
