The Bespoke 50 Top Growth Stocks – 8/5/21
Chart of the Day: Millennial Parents
Biggest Jump in Bearish Sentiment Since Last Spring
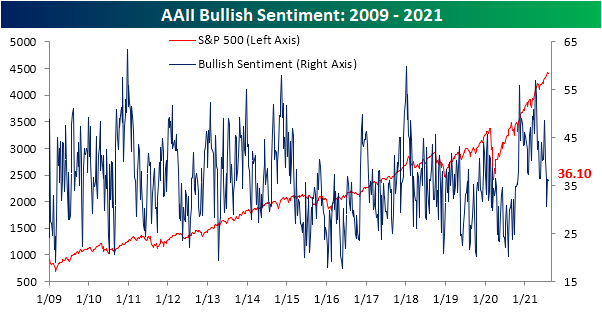
The S&P 500 has been moving sideways around record highs over the past couple of weeks. As such, bullish sentiment from the AAII was relatively flat this week. After a sizeable 5.6 percentage point jump to 36.2% last week, bullish sentiment fell 0.1 percentage points this week. With that reading, bullish sentiment is still 2 percentage points below the historical average of 38%.
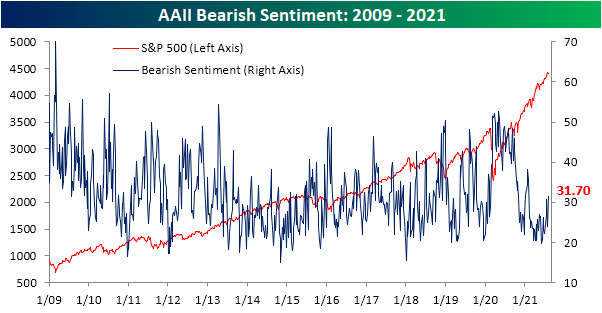
Whereas bullish sentiment did not change much, bearish sentiment surged 7.6 percentage points. That was the biggest single-week uptick since June 18th of last year when it rose 9.73 percentage points. At that time though, just under half (47.78%) of respondents reported bearish sentiment compared to only 31.7% today which is only slightly elevated versus the historical average of 30.53%. In fact, the current level of bearish sentiment is now the highest since only February. Put differently, bearish sentiment has been muted recently, and while this week’s increase was large, it does not leave sentiment at any sort of extreme level.
In spite of the large uptick in respondents reporting as bearish, sentiment continues to favor the bulls. The bull-bear spread remains positive at 4.4.

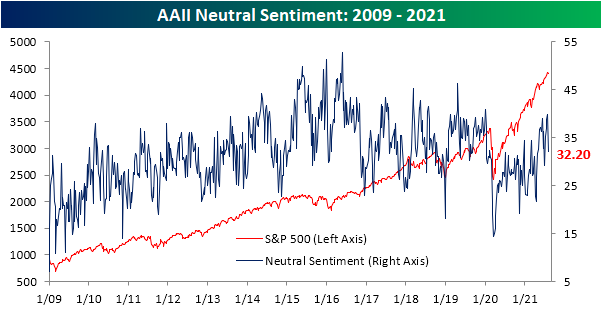
Given bullish sentiment went little changed, the rise in bearish sentiment borrowed almost entirely from those reporting as neutral. Neutral sentiment fell 7.5 percentage points to 32.2%. That is the lowest reading since the first week of July, and it was the largest week-over-week decline since April 8th. This week now marks the first time in three weeks that neutral was not the predominant sentiment reading. Click here to view Bespoke’s premium membership options.
Continuing Claims Below Three Million
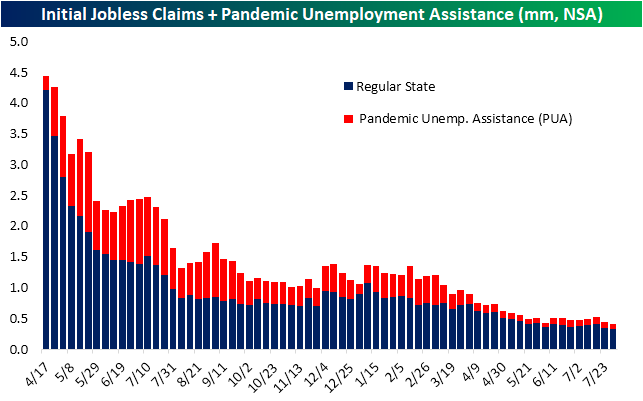
This week’s initial jobless claims number did not quite live up to expectations. From last week’s revised level of 399K, claims were expected to fall to 383K. The actual reading was 2K higher, but that still marks the lowest level since the joint pandemic low of 368K from the weeks of July 9th and June 25th.

As we have noted over the past few weeks, mid-summer has historically seen a seasonal drift lower in jobless claims. In fact, the current week of the year has seen unadjusted claims fall two-thirds of the time throughout the history of the data. With that in mind, unadjusted claims were likewise lower this week falling to 323.76K from 344.37K last week. Adding in claims from the Pandemic Unemployment Assitance (PUA) program, claims totaled 418.24K. That was a 19K decline week over week and the lowest level of claims of the pandemic. For PUA claims in particular though, there was actually a modest 1.4K increase versus the prior week.
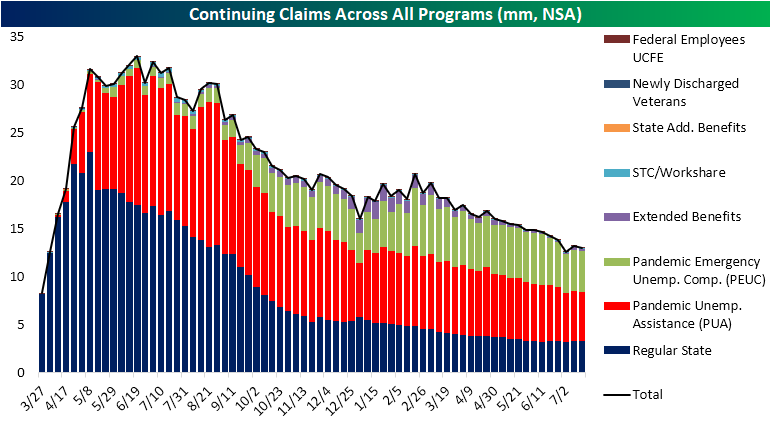
Delayed an additional week, continuing claims saw a more substantial decline dropping 366K versus last week. That was much larger than the 14K decline that had been penciled in by forecasts. Not only was it a large decline versus expectations, but it was the biggest one-week decline in adjusted continuing claims since the week of November 20th when they fell by 562K. That significant decline now leaves national claims below 3 million for the first time since March 2020.

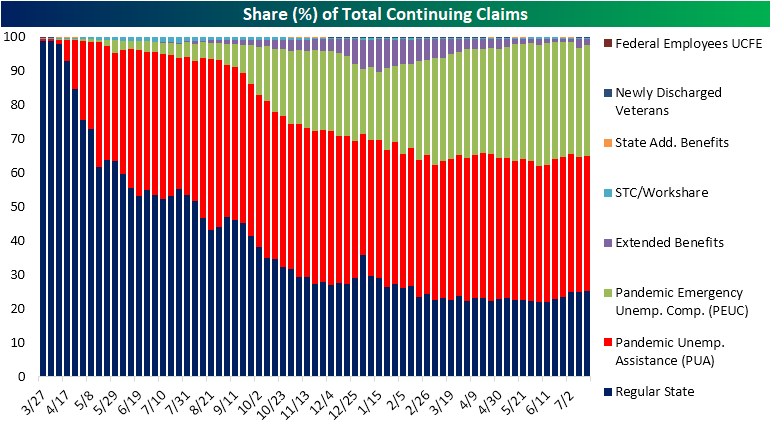
On an unadjusted basis, regular state claims came in at a pandemic low below 3 million for the first time. But adding in all other programs, which creates another week’s lag (most recent data is through the week of July 16th), total claims came in just below 13 million. While lower, that is still above the pandemic low of 12.59 million from two weeks prior. Every program with the exception of the STC/Workshare program is currently above the lows from two weeks ago. The Extended Benefits program is up the most in that time, currently 141.18K above the levels from two weeks ago. Granted, regular state programs, PUA, and PEUC programs account for much larger shares of total claims. Click here to view Bespoke’s premium membership options.
Bespoke’s Morning Lineup – 8/5/21 – Futures Higher After Earnings Deluge
See what’s driving market performance around the world in today’s Morning Lineup. Bespoke’s Morning Lineup is the best way to start your trading day. Read it now by starting a two-week trial to Bespoke Premium. CLICK HERE to learn more and start your trial.
“Tides do what tides do – they turn.” – Derek Landy
Futures are higher heading into the open and are little changed following the latest release of jobless claims. While Wednesday’s ADP report was a disappointment, jobless claims were generally positive. Initial claims were essentially right in line with forecasts, and at a level of 385K are within 20K of the past-COVID weekly low. On a continuing basis, claims finally dropped below 3 million to 2.93 million. This week’s decline of 366K was also the largest one-week drop in claims since last November.
Read today’s Morning Lineup for a recap of all the major market news and events from around the world, including a recap of German Factory Orders, some key earnings reports from around the world, the latest US and international COVID trends including our vaccination trackers, and much more.

After a bounce off its mid-July lows when it was down 10% from its 52-week high, the Russell 2000 ran out of steam right at its 50-DMA to close out the month of July. So far, August hasn’t been particularly friendly to small caps. While the S&P 500 and Nasdaq are both comfortably higher this month, the Russell is already down over 1%. Over the next couple of days, investors will be watching that index closely to see if the low from mid-July can hold.

Daily Sector Snapshot — 8/4/21
Pfizer (PFE) Partying Like It’s 1999
Last August 31st, well before the first studies on the effectiveness of COVID vaccines were published, Pfizer (PFE) was removed from the vaunted Dow Jones Industrial Average. Due to its low share price and the fact that the Dow is a price-weighted index, the Dow’s decision-makers decided to remove Pfizer (PFE) instead of competitor Merck (MRK) and replace it with much higher-priced Amgen (AMGN).
Coincidentally (or not), Pfizer (PFE) has easily outpaced Dow members Merck (MRK) and Amgen (AMGN) since the changes were made to the index last August. While Pfizer (PFE) is up 26% since it was removed from the Dow, both Amgen (AMGN) and Merck (MRK) have acted as drags on the index with declines of 10% and 7%, respectively. There is a stark difference in the chart patterns of the three shown below. (AMGN fell 6.5% today which is not yet included on the chart.)

Even after the big run it has had since the vaccine news came out late last year, Pfizer (PFE) is remarkably still trading below its all-time high made in April 1999. There aren’t a lot of blue-chip stocks left that are still below their highs from the 1990s, but PFE is one of them. After today’s move, PFE now needs to gain just 3.69% to break out to a new all-time high. You can bet that “breakout” watchers will be salivating at this one given the multi-decade resistance level that’s in place.

While PFE’s share price is still below its 1999 all-time high, long-term shareholders should at least be happy that the company pays a solid dividend. In fact, even though PFE’s share price is down since its all-time high made in April 1999, the stock’s total return (with dividends reinvested) over this time frame is +103%, which translates into an annualized return of ~3.2%. The impact that dividends have on total returns for investors cannot be overstated, and PFE is a perfect example.
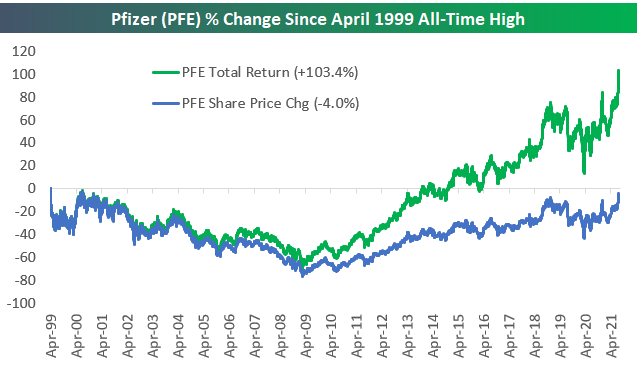
The difference in share price change and total returns is even more dramatic the further back you go. Since 1990, Pfizer’s price change has been solid at 1,523%, but its total return is 2.7x that at +4,075%. On an annualized basis, dividends reinvested add more than three percentage points to PFE’s move since 1990 (total return=12.5% vs. price change=9.2%). Click here to view Bespoke’s premium membership options.

Chart of the Day – ADP Misses By a Mile
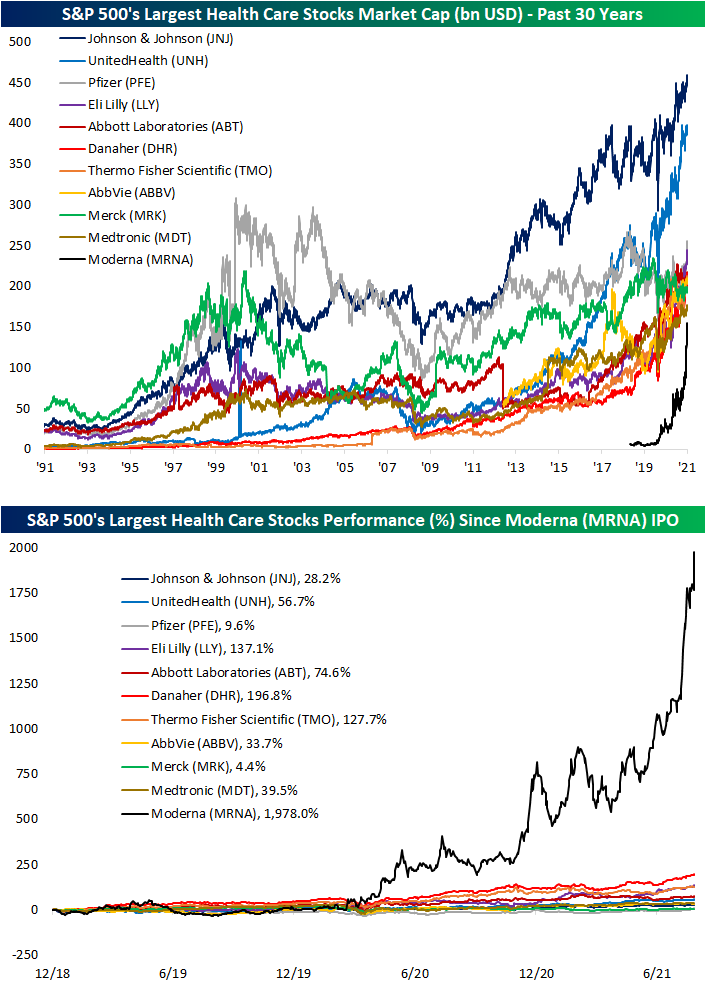
Moderna’s (MRNA) Massive Market Cap
As could have been expected in the midst of a global pandemic, one of the most rapidly growing companies has been vaccine producer Moderna (MRNA). As shown below, since the start of the year, the company has seen its market cap nearly quadruple to $162.2 billion; that is the largest growth in market cap of any S&P 500 stock year to date. In fact, those big gains saw MRNA go from the 162nd largest S&P 500 stock at the end of last year to the 58th largest today. And that compares to pre-pandemic (the end of 2019) when MRNA was only valued at $6.52 billion. While it was not part of the index back then, MRNA would have been the eighth smallest S&P 500 stock at the time with that market cap. That massive growth now leaves the stock as the tenth-largest company of all S&P 500 Health Care stocks with the next largest being Medtronic (MTD). While there are a handful of larger stocks in the Health Care sector, again, no others have seen as rapid of growth. With that said, other vaccine-related stocks like Pfizer (PFE) and Johnson and Johnson (JNJ) have also seen significant market cap growth.

MRNA joined the upper echelon of Health Care market caps in a very short span of time. As shown in the second chart below, since its IPO in late 2018, MRNA has risen nearly 2,000%. Of the ten other largest S&P 500 Health Care stocks, the next best performer has been Danaher (DHR) with just under a 200% gain in that same span of time. Click here to view Bespoke’s premium membership options.