A Record Share of People Leaving Jobs Are Quitting
Yesterday, the BLS released June data on job openings and labor turnover, also known as the JOLTS report. This alternative view of labor markets is released at a one month lag to the monthly employment situation report which includes the nonfarm payrolls number. In additional to openings, JOLTS also includes a look at quits and other separations from businesses which include retirements, firings, and other departures. Since the data begins in 2000, the average month has seen quits account for about 55% of total separations. Over the last three months, that number has surged to nearly 70% and is sitting at a record level. One thing we can say with great confidence about the current labor market: lots of workers are quitting for greener pastures. Click here to view Bespoke’s premium membership options.
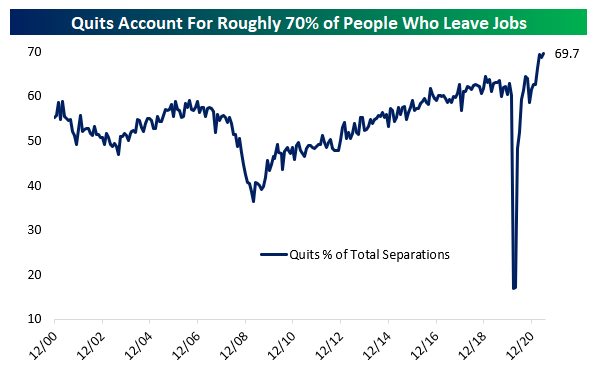
Chart sources: BLS, FRED, Bespoke Investment Group calculations
Bespoke In-Depth: Economic Sentiment, NFIB, and COVID Updates
July 2021 Headlines
Bespoke’s Morning Lineup — 8/10/21
See what’s driving market performance around the world in today’s Morning Lineup. Bespoke’s Morning Lineup is the best way to start your trading day. Read it now by starting a two-week trial to Bespoke Premium. CLICK HERE to learn more and start your trial.
“All that glitters is not gold.” – William Shakespeare
It’s a relatively slow news morning in equity markets. S&P 500 and Nasdaq futures are indicating a slightly higher open, while the Dow 30 is set to open slightly lower. Bitcoin is down 1% while gold and oil are bouncing back a bit after trading deeply oversold (more on that below). The 10-year yield is up slightly after crossing above 1.3% yesterday.
Read today’s Morning Lineup for a recap of all the major market news and events from around the world, including key earnings reports out of Europe and the latest US and international COVID trends.
Also, make sure to check out our Daily Sector Snapshot.

The ARK Innovation ETF (ARKK) appears ready to break out of the downtrend it has been in since peaking in the first quarter. Over the last two months, ARKK has managed to make a series of higher lows and is now just above the “flag” pattern that has emerged.

Given its 10% weighting in the ARKK ETF, Tesla (TSLA) has had a lot to do with ARKK’s broader move. As shown below, TSLA has also broken out of its downtrend in recent weeks.

Want to see more charts like this? Start a two-week trial to Bespoke Premium and read today’s full Morning Lineup.
Daily Sector Snapshot — 8/9/21
Chart of the Day: Sector ETF Total Returns
Google Search Trends
One of the widely talked about pandemic trends has been an increased interest in the stock market. Quantifying this, below we show data from Google Trends. These indices track search interest for various terms where readings of 100 are the peak in interest for a given time frame, a reading of 50 would be when interest was half of that peak, and so on and so forth. Google searches for “Stocks” surged to record highs during last year’s bear market and those highs were taken out earlier this year around the time of the meme stock mania in late January. The same could be said for searches for “Buy Stocks”. Since then, that interest has unwound but current levels are still above most pre-pandemic levels. (Red dots indicate search levels during the week of August 9th over the last five years.)

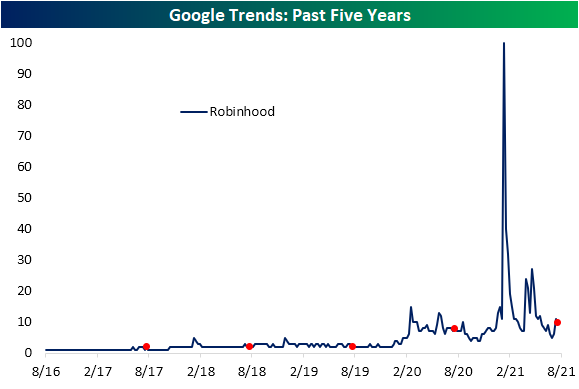
The same could be said for search interest for various brokerages. Taking a look at the most popular, Robinhood, search interest spiked higher during the meme stock mania and GameStop (GME) short squeeze early this year before getting another boost in the spring around the time of the surge in AMC Entertainment (AMC). Interest has moderated since then, though, the past several weeks have seen a boost potentially as a result of the IPO of the company.
Inflation continues to be a macroeconomic subject that is closely watched, but for the time being, people are searching for it far less than earlier this spring. In May, searches for “Inflation” reached the highest point on record, and while they are still elevated, the reading has come down a bit. Searches for “Rising Prices” tell a similar story, though, it peaked earlier in the late winter.

With searches for inflation having surged in the past year, we thought it would be worth looking at search interest for some typical hedges like gold. While these searches also surged to a record recently, it should be taken with a grain of salt, after all, it is an Olympics year. As shown in the second chart below, historically the month in which the Olympics fall usually sees searches for gold spike.

Turning to a more speculative area of the market, below we show searches for crypto-related products. Bitcoin remains well above most other periods of the past five years but it has been declining and is back below the past year’s range. Additionally, the highs from earlier this year were far from ever hitting the same interest as the craze in late 2017/early 2018. On the other hand, “Crypto”, “Coinbase”, and “NFT” search interest has come back down to earth after all reaching records earlier this year. These have also seen minor reversals recently with “NFT” in particular seeing a decent-sized bounce.

While those digital collectibles have seen interest turn around slightly, searches for “Collectibles” more broadly or a more specific term like “Rookie Card” have been drifting lower. Interestingly, searches for these collectibles certainly got a boost during the pandemic, but they actually began to trend higher just prior in late 2019. Click here to view Bespoke’s premium membership options.

How Far & How Fast Do Markets See The Fed Tightening?
With more and more members of the FOMC talking about the need to taper or when they expect rate hikes to occur, it’s worth looking at the baseline assumptions around the pace of hikes that markets currently price. The spreads between different Eurodollar future maturities allow us to show how much markets think rates will change over a given period.
As shown below, current pricing is for less than 1 hike in 2022. Pricing is more aggressive in 2023 with two hikes while years further out are around 1 hike each, with slightly more aggressive pricing in 2024 than 2025. Of course, market pricing is often wrong – in both directions. This is just what’s currently priced, and the numbers aren’t that dramatic: a total of just more than 5 hikes over 4 years. Click here to view Bespoke’s premium membership options.
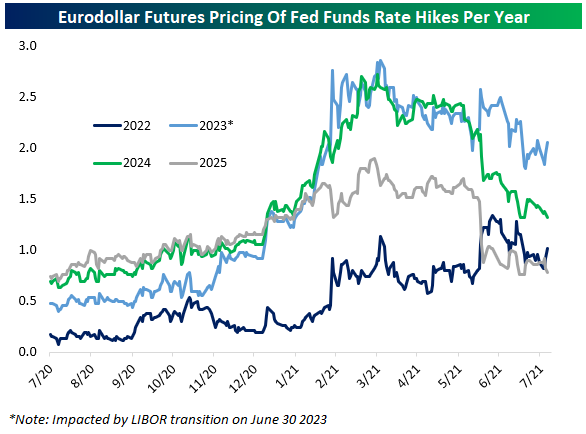
Chart sources: Bloomberg
Bitcoin Rallies 58% in Last 20 Days
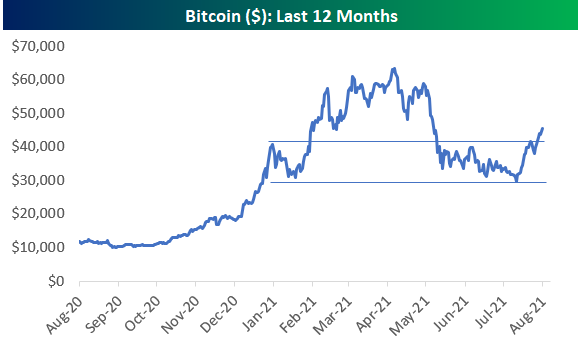
Bitcoin made a low of $29,307 back on July 20th, which was down 54.8% from its record high made on April 14th. In the 20 days since July 20th, Bitcoin has now rallied 58% to cross back above $46,000. (Remember, a decline of 50% means you need a rally of 100% to get back to prior highs.) As shown below, Bitcoin crossed above a key resistance level in the low $40,000s on its move higher over the last few days, which leaves quite a bit of space between its current level and the next areas of resistance above.
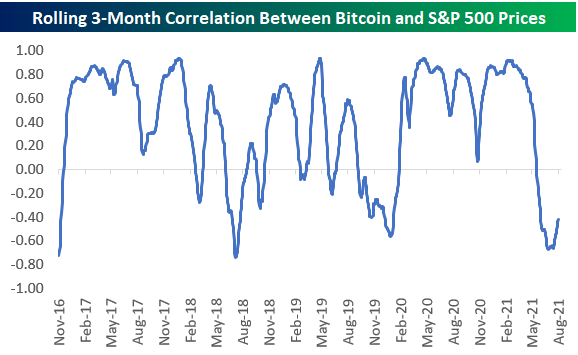
The chart below shows the rolling 3-month correlation between the daily price of Bitcoin and the S&P 500. Just a few weeks ago, this correlation reading got as low as -0.67, although it has been bouncing higher over the last couple of weeks. Click here to view Bespoke’s premium membership options.
Shorted Names Cool Into the Summer
This year has seen two bouts of interest in highly shorted names. The first in January when GameStop (GME) was the main stock in focus with a short interest as a percent of float above 100%, and again in late May/early June when AMC Entertainment (AMC) became the new poster child. As shown below, while those two stocks and a handful of other individual names have seen the spotlight this year due to massive short squeezes, in aggregate short interest as a percentage of free float across the US equity market has pulled back over the past couple of years. Some of that decline was erased from February to April, but since the spring, short interest has flatlined.

Below is a Bloomberg index that tracks the 100 most highly shorted US stocks rebalanced monthly and dating back to February 2020. The index remains well off the highs from this February when it surged on the initial squeeze in GME and various other names. The unwind since then has brought the index down to the longer-term uptrend line that has been in place in the index’s year and a half history.

As for the two stocks that were the main short squeeze names earlier this year, AMC and GME, both stocks are still up huge on the year (1,571.14% and 823.19%, respectively) but have fallen well off their highs and have been trending lower.

Taking a look at what are currently the most heavily shorted stocks in the Russell 3,000, retailers take the top spot with the average stock having a 9.7% short interest as a percent of float. Pharmaceutical, Biotech, and Life Science stocks are the only other industry in which the average stock has a short interest above 9%. Autos in addition to Food & Staples Retailing are the other two sectors with notably elevated short interest. Conversely, Banks, Utilities, Insurance, and Commercial and Professional Services have a relatively low short interest versus the Russell 3,000 average of 5.5%.

Taking a more granular look, in the table below we show the stocks in the Russell 3,000 that currently have the highest short interest as a percent of float as well as their year-to-date performance. Recent IPO Reneo Pharmaceuticals (RPHM) tops the list with just under half of its shares sold short. That is as the stock has gotten crushed since its debut having fallen 40%. GreenBox (GBOX), Skillz (SKLZ), Beam Global (BEEM), and Workhorse Group (WKHS) round out the top five, all with more than 37% of their float sold short.
Looking across many of the other highly shorted names, though, big losses are pretty common on a year-to-date basis with 60% of these names in the red. That was not always the case, though. Performance was slightly better two months ago during the AMC saga and performance was even more positive at the GME high one month into the year. Click here to view Bespoke’s premium membership options.
