Richmond Adds to Regional Manufacturing Pain
Last week’s releases of the Philly and New York Fed manufacturing surveys showed broad slowdowns in activity, and today’s release of the Richmond Fed’s reading only reaffirmed those findings. The headline number went from a near-record high of 27 in July down 18 points to 9 in August. That is the lowest reading since last July. While that still indicates the region’s manufacturing economy is continuing to grow at a historically healthy clip, the massive decline month over month points to a historic slowdown. In fact, the 18 point decline was the third largest one-month drop on record behind 22 and 49 point declines in February and April of last year, respectively.
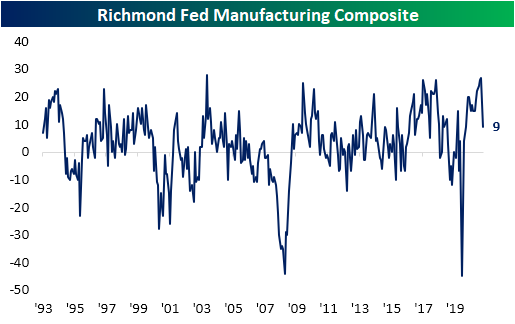
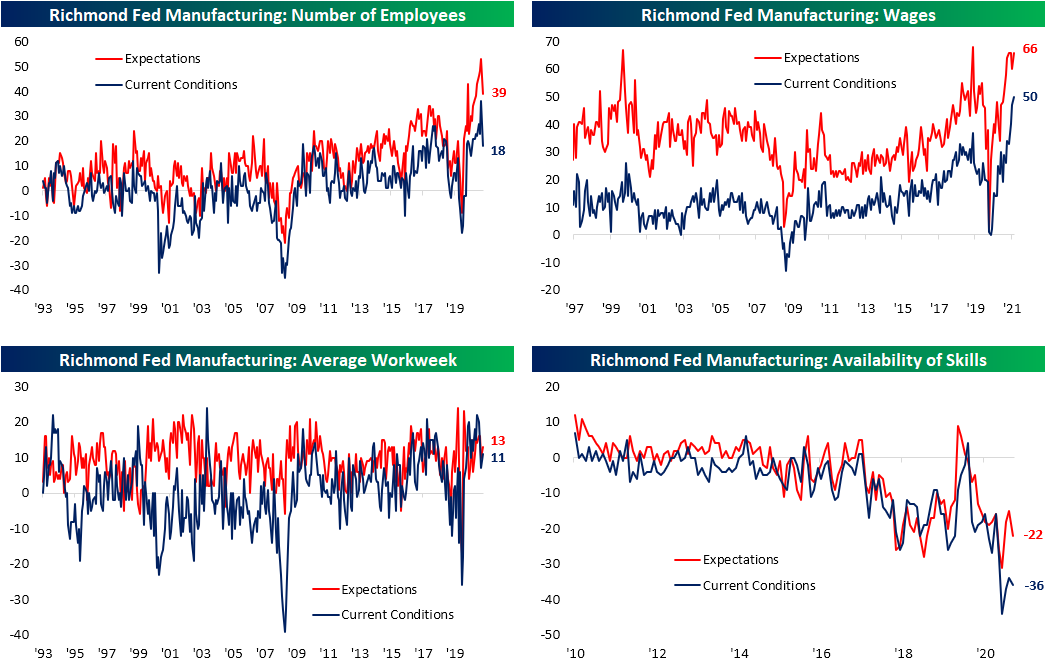
Given the headline number dropped by such a large degree, many of the sub-indices of the report similarly saw declines that rank in the bottom few percentiles of each one’s respective history of month over month changes. Just like the composite reading, if there is a silver lining to be had, most indices are again coming off of near-record levels meaning those large declines only leave them in the middle of their historical ranges at worst as is the case for New Orders and Shipments. Additionally, current readings mostly remain positive indicating that there is still growth across components, but at a more modest pace. The only negative indices are Local Business Conditions, the two indices covering inventories, and Availability of Skills. While some good can be reasoned with negative readings in inventories and availability of skills—for instance, those negative readings can mean firms will need to increase production with strong demand and there is a tight labor market—the drop in local business conditions is more concerning and likely a result of rising COVID cases.

As previously noted, the indices for New Orders and Shipments remain at solid levels consistent with growth in spite of the massive declines month over month. As such, Order Backlogs remain fairly elevated in the 88th percentile. While the growth of backlogs slowed dramatically alongside new orders, supply chains continue to look abnormal. Even though the index for Vendor Lead Times has fallen four points from the record high set back in May, the current reading remains well above any historical precedent.

Given lead times are long and backlogs are still elevated, inventories are also historically low. That is the case for both raw and finished goods. Each of these indices remains negative in the bottom 1% of all readings, but they did see sizable bounces in August. In other words, the region’s firms continue to report that they are drawing upon inventories at a historic rate while vendor lead times are likely not allowing those inventories to be replenished at a more desirable rate.

Prices paid finally got some relief, albeit it was not much. Prices paid rose at a 11.05% annualized pace versus a record high of 11.16% in July. Conversely, Prices Received continue to make parabolic moves rising 9.25% annualized.

Not only are prices paid and received near/at record highs, but wages also set the record bar even high. While wages are rising, actual hiring saw a substantial pullback from a record high as more firms reported a lack of workers with necessary skills. Click here to view Bespoke’s premium membership options.
Nasdaq Crosses Another 1,000 Point Threshold
It won’t be official until the close, but with the Nasdaq crossing 15,000 for the first time today, it’s on pace to cross its third 1,000 point threshold this year and the sixth since the pandemic began in early 2020. The table below lists each 1,000 point threshold that the Nasdaq has crossed over time along with the first day that it crossed that threshold, the number of days since the prior cross, what percentage that 1,000 point consists of relative to the prior threshold, and then how many upside and downside crosses the Nasdaq has had around that level on a closing basis.
Of all the 1,000 point thresholds the Nasdaq has crossed over time, the only one that it never traded back below after crossing it was 6,000 back in April 2017. Besides 1,000, that was also the 1,000 point threshold that took the longest to cross above. After first crossing 5,000 back in March 2000, it took 6,256 days for the Nasdaq to top 6,000. Since then, though, the Nasdaq has been making quick work of 1,000 point thresholds. With the exception of the 486-day gap between 8K and 9K, every other 1,000-point threshold since 6,000 has taken less than a year to cross. Even in the midst of a global pandemic, it took the Nasdaq less than six months to get from 9,000 to 10,000.

The long-term chart of the Nasdaq below includes red dots to show each time the Nasdaq first crossed a 1,000 point threshold along with the number of days for each one.

Looking at the chart above may give you a feeling of lightheadedness given the seemingly parabolic nature of the last few years. An important thing to keep in mind, though, is that as a percentage of the index’s price level, every 1,000 point threshold represents a smaller move in percentage terms. While the move from 9K to 10K represented a move of over 11%, the move from 14K to 15K represents only a little more than 7%. Looking at this chart on a log scale where each label on the y-axis represents a doubling of the index shows how modest the recent 1,000 point thresholds have been relative to earlier ones. Think about it this way, in the less than two years between when the Nasdaq first crossed 2K to when it crossed 5K for the first time (four different 1,000 point thresholds), it rallied 150%. Over the last four years, though, the Nasdaq has crossed 10 different 1,000-point thresholds, but the gain has also only been 150%. Click here to view Bespoke’s premium membership options.

Chart of the Day: Crude Oil Breaks a Losing Streak With Authority
Bespoke’s Morning Lineup – 8/24/21 – Drifting Lower
See what’s driving market performance around the world in today’s Morning Lineup. Bespoke’s Morning Lineup is the best way to start your trading day. Read it now by starting a two-week trial to Bespoke Premium. CLICK HERE to learn more and start your trial.
“They always say time changes things, but you actually have to change them yourself.“ – Andy Warhol
US equities are still indicated to open higher today, but futures are off their overnight highs. Following a strong session in Asia, European markets opened higher but have been trending lower since the open. The only economic reports on the calendar today are the Richmond Fed and New Home Sales which will both be released at 10 AM.
Read today’s Morning Lineup for a recap of all the major market news and events from around the world, including the latest US and international COVID trends.
The S&P 500 came close but finished just shy of closing at a record high yesterday. The Nasdaq, meanwhile, managed to close at its 28th record high of the year. At the current pace so far this year, the Nasdaq would finish the year with 43 record closing highs. So, where would that rank relative to history? Dating back to 1971, there have actually been nine other years where the Nasdaq finished the year with 43 or more record closing highs. The most recent was last year when there were 55 and before that, you only have to go back to 2017 when there were a record 72. That’s one every three to four days!
 Start a two-week trial to Bespoke Premium and read today’s full Morning Lineup.
Daily Sector Snapshot — 8/23/21
Chart of the Day: Bitcoin Sentiment
Moving Averages By Sector and Market Cap
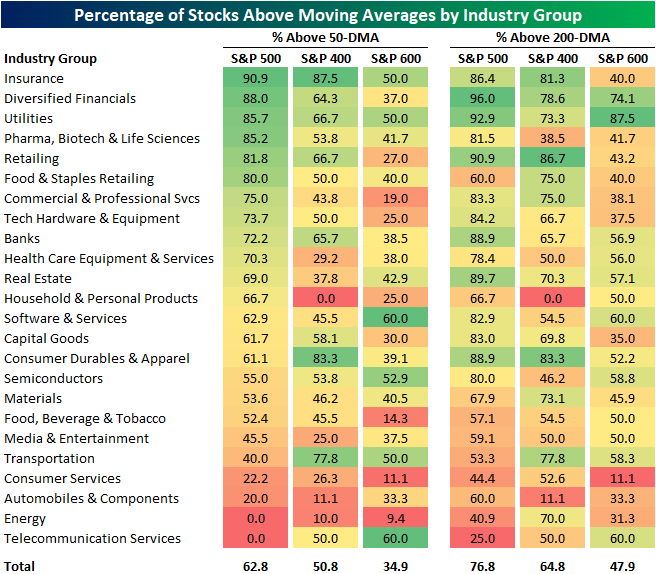
On Friday, we highlighted how a growing number of stocks were falling below their 200 and 50-DMAs recently, but there was a noticeable difference between those readings within large, mid, and small caps. Taking a more granular look, in the table below we show the percentage of stocks currently above their moving averages for each market cap bracket—large- (S&P 500), mid- (S&P 400), and small-caps (S&P 600)—by industry group.
For the most part, each industry group shows the same dynamic in which large caps generally have a stronger reading in the share of stocks trading above their moving averages, but there are a few industries where that is not necessarily the case. For example, mid-caps actually have the strongest readings for industries like Consumer Services and Energy, and Telecommunication Services has the strongest readings for small caps.
As for which industry groups currently have the healthiest readings in the number of stocks above their moving averages, Insurance tops the chart with around 90% of S&P 500 and 400 stocks in the industry above their 50-days. Of course, for small caps, there is a steep drop off though. On the other hand, Diversified Financials and Utilities also have some of the strongest readings in the number of stocks above their moving averages, and that is especially the case with regards to their longer-term 200-DMAs. Click here to view Bespoke’s premium membership options.
Ditching the Friendly Skies
From the start of the year through August 1st, air passenger traffic in the US experienced a massive rebound with the seven-day average passenger throughput in the US more than doubling from just over a million to 2.082 million. What was notable about that August 1st level was that it was pretty close to average throughput levels seen in late Summer/early Fall of 2019 before the pandemic ground things to a halt in early 2020.
August has been unfriendly to the skies, though, and ever since that peak reading on 8/1, passenger traffic has been drifting lower. The Delta variant and the accompanying surge in cases has no doubt had an impact on air passenger traffic, but seasonality has likely been a contributing factor as well. While we don’t have passenger traffic levels prior to August 2019, it only makes sense that as schools start to go back into session and the Summer vacation season comes to a close, Americans are going to be travelling less for vacation.

What’s been interesting about the recent fall-off in air passenger traffic levels has been how steady but modest the declines have been. Starting with the steady aspect, the chart below shows the number of consecutive days that air passenger traffic has declined on a week/week basis. Sunday marked the 21st straight day that passenger traffic declined on a w/w basis, making it the longest streak of the pandemic behind the 18 trading day streak ending right around the election last year.

While the declines in passenger traffic have been steady, the magnitude has been modest. The chart below shows the w/w change in passenger traffic over the last two years, and the declines of the last three weeks have been notably modest. During the current three-week decline, the maximum w/w decline has never reached double-digit percentages. In fact, the last time air passenger traffic was down over 10% on a w/w basis was seven weeks ago on July 4th. One has to think that if Delta variant concerns were really having a major impact on air travel, the drop-off in air traffic would have been more abrupt, similar to what occurred in the early stages of the pandemic. Click here to view Bespoke’s premium membership options.

Bespoke’s Morning Lineup – 8/23/21 – Getting Back on Track
See what’s driving market performance around the world in today’s Morning Lineup. Bespoke’s Morning Lineup is the best way to start your trading day. Read it now by starting a two-week trial to Bespoke Premium. CLICK HERE to learn more and start your trial.
“Creating success is tough. But keeping it is tougher. You have to keep producing, you can’t ever stop.” – Pete Rose, who was permanently banned from Major League Baseball on this day in 1989.
US equity futures opened modestly higher Sunday evening and have been building on those gains ever since. Along with higher equities, crypto-markets are also rallying as bitcoin tops $50K. While there hasn’t been much improvement in the situation over in Afghanistan over the weekend, it hasn’t gotten any worse either. The focus going forward this week will be on the Fed’s (now virtual) Jackson Hole conference later this week.
Read today’s Morning Lineup for a recap of all the major market news and events from around the world, including the latest US and international COVID trends.
A look at the major averages to kick off the week shows the current dichotomy between small and large caps. In the small-cap space, the Russell 2000 remains right near the low end of its YTD range, and after closing below its 200-day moving average (DMA) for a day, it bounced back on Friday to close out the week on a positive note. Large-cap stocks, as proxied by the Nasdaq 100 and S&P 500 didn’t even test their 50-day moving averages last week, but like the Russell 2000, they also bounced Friday helping to erase much of the declines from earlier in the week.
 Start a two-week trial to Bespoke Premium and read today’s full Morning Lineup.