Bespoke Short Interest Report: 2/25/16
Bullish Sentiment Bounces
After several weeks of back and forth action in bullish and bearish sentiment, this week we saw both measures start to break out of their recent ranges. According to the weekly sentiment poll from AAII, bullish sentiment rose to 31.2% last week. That’s still depressed by historical standards, but it is still the highest weekly reading since November! Similarly, bearish sentiment dropped from 37.8% down to 31.4%, which was the lowest level of the year. It’s a start!

US Equity ETFs Attempting to Move Back Above 50-DMAs
Below is a snapshot of U.S. equity index and style ETFs that we track in our daily ETF Trends report available to Bespoke Premium and Bespoke Institutional members. A few key columns that only subscribers can see have been removed, but this snapshot still gives you a good idea of where the market stands.
In the trading range section below, the black vertical “N” line represents each ETF’s 50-day moving average. As you can see, nearly every ETF is currently in neutral territory, with most just a notch below their 50-day moving averages. If we get a decent up day today, though, the large majority will end up breaking back above their 50-days for the first time in weeks. We wouldn’t get too giddy just yet, but this kind of move is what bulls are looking for if the longer-term downtrends in place are going to be broken.

Jobless Claims Slightly Higher Than Expected
After two weeks of significantly stronger (lower) than expected jobless claims reports, this week’s reading came in slightly higher than expected. While economists were forecasting first-time claims to come in at a level of 270K, the actual reading came in at 272K which was up 10K from last week. That’s the highest reading this month, and as shown in the inset chart below, it takes claims right up to that uptrend line it broke to the downside last week. Going forward, it is reasonable to expect claims to tick higher, but the key is that they stay stable and don’t suddenly spike above 300K.

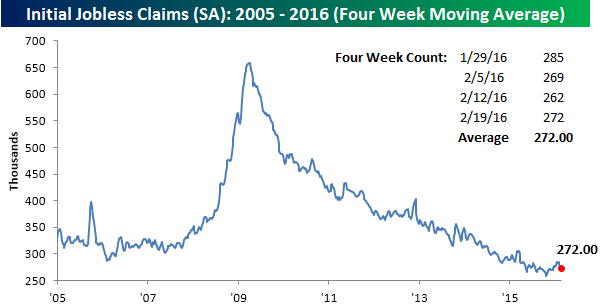
Although the weekly reading increased this week, the four-week moving average actually declined slightly, falling from 273.25K down to 272K (the same level as the weekly reading). Again, this is a healthy reading as it’s just 13K above the cycle and multi-decade low of 259.25K from late October and the lowest since mid-December.
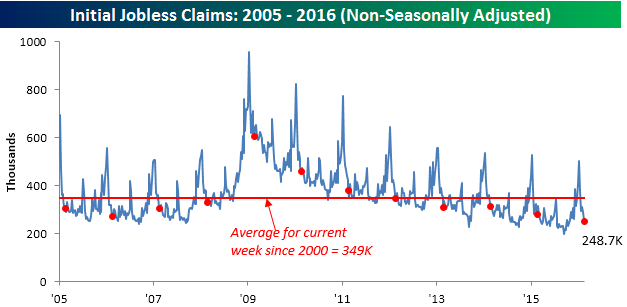
On a non-seasonally adjusted basis, claims continue to come in solid. At a level of 248.7K, claims are more than 100K below the average of 348.9K for the current week going back to 2000, and to find a week where claims were lower in this particular week of the year, you have to go all the way back to 1973.
The Closer 2/24/16 – “Housing Dividends”
Looking for deeper insight on global markets and economics? In The Closer tonight we analyze the drivers of performance for high dividend stocks since December. We also break down two housing data points from today (New Home Sales) and yesterday (Existing Home Sales).
The Closer also includes its standard charts, large volume and price movers in the US equity market, and Bespoke’s Market Timing Model. The Closer is one of our most popular reports, and you can sign up for a trial below to see it free for the next two weeks!
[thrive_leads id=’58717′]ETF Trends: US Indices & Styles – 2/24/16
Energy, Tech, Materials Lead the Reversal Higher
The S&P 500 turned around a 1.55% decline at the lows this morning to finish higher on the day by 0.44%. It was actually just the 37th time since 1983 that the S&P has reversed a 1.5%+ decline before 11 AM ET and rallied 1.5%+ to finish higher on the day. And even more remarkable is that this already happened earlier this month on February 3rd!
So what led the turnaround? Below we show the performance of the ten S&P 500 sectors today. For each sector, we show its decline at its low for the day, its rally from its low to the close, and its full day’s change.
As shown, the Energy sector rallied the most off of its lows at 3.12%, followed by Technology, Consumer Discretionary and Materials. The three defensive sectors — Utilities, Consumer Staples and Telecom — rallied the least. Notably, the only sector that couldn’t manage to close higher on the day was Financials, which finished down 20 basis points on the day.

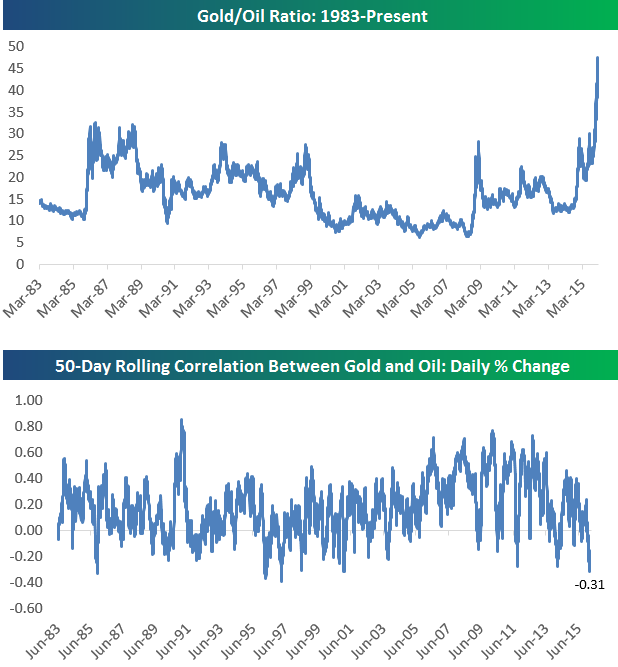
Gold to Oil Ratio Hits Record High; Daily Correlation Hits 19-Year Low
In our last post we provided an updated snapshot of commodity performance in 2016. With gold up big and oil down big, we decided to look at the ratio between the price of an ounce of gold and a barrel of oil. Below is a chart of this gold/oil ratio since 1983. When the line is rising, gold is outperforming oil and vice versa. As shown, the collapse in oil and bounce back in gold has caused the ratio to go parabolic recently to its highest level ever. What this means, we’re not really sure, but it’s interesting nonetheless.
The second chart below is also notable. It shows the rolling 50-day correlation between the price moves (daily % change) in gold and oil. When the line is falling, the two are becoming less correlated and vice versa for a rising line. As shown, the correlation between gold and oil over the last 50 trading days stands at -0.31, which is the most negatively correlated they have been over a 50-trading day period since 1997.
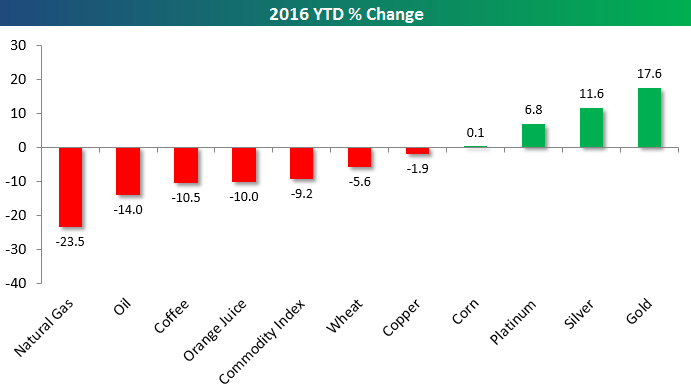
Bespoke Commodity Snapshot
Below is an updated look at the year-to-date percentage change of various commodities. As shown, while natural gas, oil, coffee and orange juice are down more than 10%, the precious metals are all up nicely in 2016. Gold is leading the way on the upside with a huge gain of 17.6% over the first two months of the year.
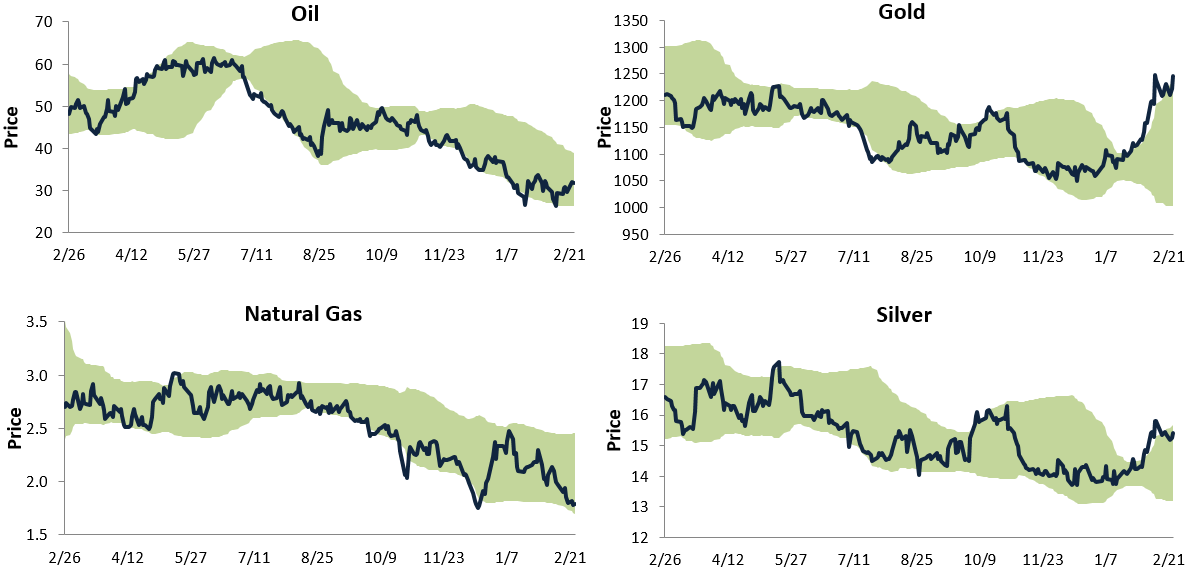
Below are trading range charts for oil, natural gas, gold and silver. In each chart, the olive green shading represents between two standard deviations above and below the commodity’s 50-day moving average.
Both gold and silver have skyrocketed to the top of their trading ranges recently. And while natural gas is at the bottom of its range, oil has actually bounced off of oversold levels back into neutral territory.