S&P 500 Weekly Chart Book: 2/26/16
Final Earnings Season Triple Plays — 2/26/16

The fourth quarter earnings season unofficially came to an end last week with Wal-Mart’s (WMT) report, but another 575 companies have reported numbers since then. Our job here is to identify the earnings reports that look the best, and with that we have updated our list of earnings season triple plays.
Long-term Bespoke subscribers know how much we like triple plays, but for those that haven’t heard of the term, we came up with it back in the mid-2000s for companies that beat analyst earnings estimates, beat analyst revenue estimates and also raised guidance. Investopedia.com is one of the best online resources for financial markets education, and they’ve actually given us credit for coining the “triple play” term on their website. We consider triple play stocks to be the cream of the crop of earnings season, and we are constantly finding new long-term buy opportunities from this basket of names each quarter.
Since the just-finished earnings season began in early January, companies that have lowered guidance have outnumbered companies that have raised guidance by a margin of 3 to 1. Very few companies actually raised guidance, so that made the crop of triple plays this season low. But that makes the 59 companies that actually did report triple plays this season look even better, and we detail them in our quarterly Earnings Triple Plays report that just went out to Bespoke Premium and Bespoke Institutional subscribers. We also filter the triple plays list even further to feature our 10 favorite stocks in the report. If you want to see these triple play stocks, sign up now using the offer below!
See our top earnings season triple plays by signing up for a monthly Bespoke Premium membership now. Click this link for a 10% discount ($89/month).
Final Earnings Season Beat Rate Stats
Earnings season came to an end last week with Wal-Mart’s (WMT) report last Thursday. Below is a look at the final top and bottom line beat rates for U.S. stocks that reported numbers this quarter. The first chart shows the percentage of companies that beat consensus analyst earnings estimates while the second shows the percentage that beat consensus analyst revenue estimates.
As shown, the earnings beat rate ended at 63%, which is actually the highest reading seen in five years going back to Q4 2010! At 52%, the top-line revenue beat rate was significantly lower than the bottom-line earnings beat rate. The positive take away from the revenue beat rate is that it was stronger than the prior quarter’s reading of just 47% and near the high end of the range from the prior three quarters

Below is a distribution chart of every single company that reported earnings this season. The vertical y-axis shows the average one-day price change (%) that the stock experienced in reaction to its earnings report. We’ve segmented the stocks by earnings beats and misses (and inline reports as well). The average one-day price change for companies that beat estimates was +1.90%, but companies that missed estimates fell an average of 3.7% on their report days. More notable is that companies that reported inline numbers fell an average of 0.73% on their report days. This shows why companies are under such pressure to “beat the number”, or report stronger than expected earnings. These day, simply meeting expectations is usually met with falling share prices.
For additional earnings analysis and much more, become a Bespoke subscriber today and check out our weekly Bespoke Report newsletter due out later today.
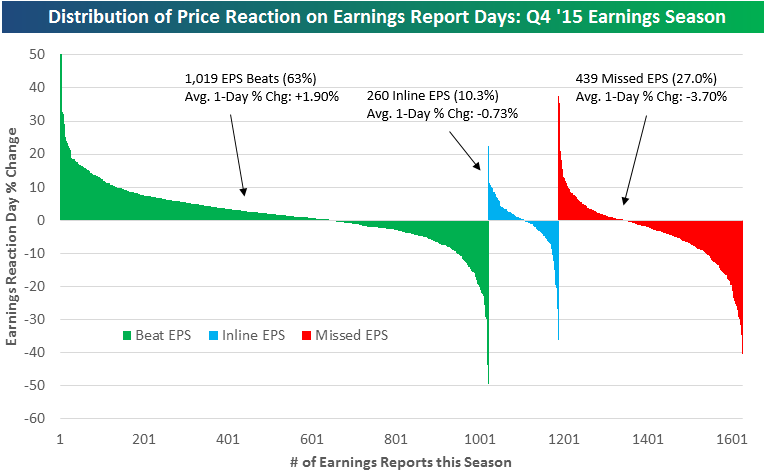
Chart of the Day – 2/26/16: Short Interest in Energy Approaching Levels of Financials From 2008
Short interest levels for the middle of February were released earlier this week, and in today’s Chart of the Day, we take a look short interest levels in the Energy sector which approaching a critical level.
To continue reading our Chart of the Day, enter your info below and start a free Bespoke research trial. During your trial, you’ll also receive access to our model stock portfolios, daily market alerts, and weekly Bespoke Report newsletter.
[thrive_leads id=’59052′]
B.I.G. Tips – Consumer Staples Caution
Q4 2015 GDP Revised Up, But A Low-Quality Beat
Economists were expecting a +0.4% QoQ SAAR GDP reading for Q4 2015 on the second reading from the BEA this morning, but growth came in much higher at +1.0% QoQ SAAR. However, the most important categories (in our view), Consumption and Fixed Investment, were both revised downward slightly. Less goods consumption and a slightly slower rate of residential fixed investment weighed, with goods contributing the most. The upward revision to the headline was instead driven by less negative contribution from inventories. Growth in stockpiles of goods reduced GDP by 14 bps QoQ SAAR, versus a -45 bps SAAR impact on the initial release. Also contributing to higher growth was slower imports, which makes sense if goods consumption was lower. Finally, government spending was revised down with Federal outlays contributing +15 bps SAAR versus +18 bps SAAR on the initial release. Local government spending was revised dramatically lower, to -16 bps contribution; that’s the weakest since the recession. This is extremely surprising and in our view unlikely to continue given strong employment, real estate prices, and steady balance sheet repair across that spectrum of government.
Overall, while it’s nice to see growth revised up, it was revised up for the wrong reasons. The brutal contraction in state and local spending is also painful. We’ll have more on this in our weekly Bespoke Report tonight; sign up for any of our research offerings to view the report when it’s sent out this evening.

Bespoke CNBC Appearance (2/25)
Bespoke’s Paul Hickey appeared on CNBC’s Fast Money on Thursday afternoon to discuss the recent higher high made in the number of stocks trading at overbought levels and what it means for the short-term direction of the market. To view the segment, click on the image below.

US Equity ETFs Move Above 50-DMAs
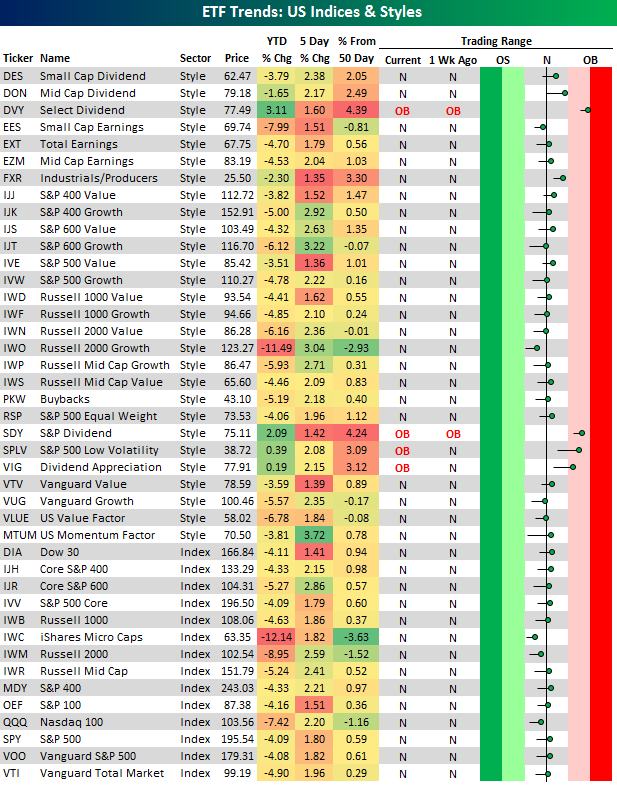
Yesterday morning we published a post titled US Equity ETFs Attempting to Move Back Above 50-DMAs. In the post we highlighted our trading range screen of equity index and style ETFs, which we have updated below. Prior to yesterday’s open, nearly all of the ETFs shown were trading just below their 50-days and needed just a little boost to break back above them. As you can see in the updated screen below, nearly all of them did indeed break above their 50-days by the close yesterday.
Sector Breadth Bouncing Back
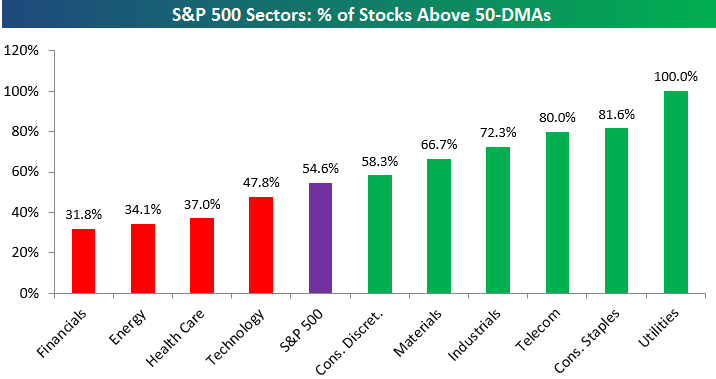
In our weekly Sector Snapshot available to Bespoke Premium and Bespoke Institutional members, we provide a number of charts covering sector technicals, internals, relative strength and valuations. Below is data taken from this week’s Sector Snapshot published today showing the percentage of stocks in each sector trading above their 50-day moving averages. For the entire S&P 500, this reading has moved back above 50% — up to 54.6% today. That’s a healthy reading that we haven’t seen yet in 2016.
Six of ten sectors have readings even stronger than the 54.6% mark for the broad S&P 500. Utilities ranks at the top at 100%, followed by Consumer Staples and Telecom, but then you get to Industrials, Materials and Consumer Discretionary. Those last three are all cyclical in nature, and they’ve been market leaders over the last couple of weeks.
Notably, the four sectors with weaker-than-market readings are all cyclical in nature as well, and Financials rank worst with just 31.8% of stocks above their 50-days. Energy and Health Care are both in the 30s as well.
While the bounce for the market off of its lows has been a positive, for it to have any staying power, it’s going to need these four cyclical sectors to participate even more than they have been.
The Closer 2/24/16 – “Manufacturing Turning Up Definitively”
Looking for deeper insight on global markets and economics? In The Closer tonight we update our view on the manufacturing sector following a series of changes in a number of trends for nominal factory output. We also summarize some indicators on the market that are painting quite unambiguous signals on direction. Finally, we preview a very significant overnight data slate and two major US releases tomorrow.
The Closer also includes its standard charts, large volume and price movers in the US equity market, and Bespoke’s Market Timing Model. The Closer is one of our most popular reports, and you can sign up for a trial below to see it free for the next two weeks!
[thrive_leads id=’58717′]