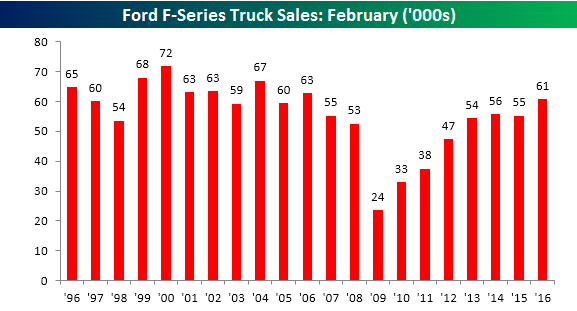
Ford Truck Sales Rebound
Monthly auto sales for February are being released from the major OEMs this morning. Within these monthly releases, we like to track sales of pickup trucks (specifically at Ford) as they are often a sign of strength or weakness in the small business and construction sectors. For the month of February, Ford saw strong F-series sales with a total of 60,697 units sold. Relative to last February, that represents an increase of 9.9% in a month where the number of selling days in each month was the same (24 days). The last time Ford sold more trucks in February was ten years ago back in 2006 when it sold 62.9K units.
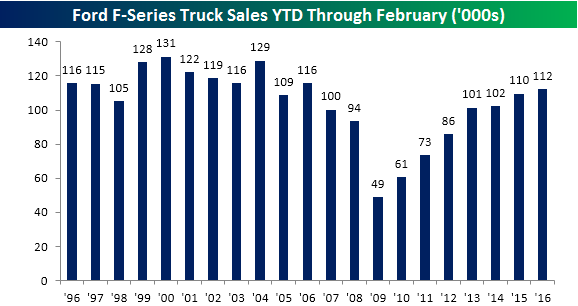
On a year to date basis, Ford F-Series truck sales now total 112.237K. This is also the strongest first two months of the year since 2006 and represents a 2.4% increase over the first two months of last year despite the fact that total selling days this year (48 days) are two less relative to last year (50 days).
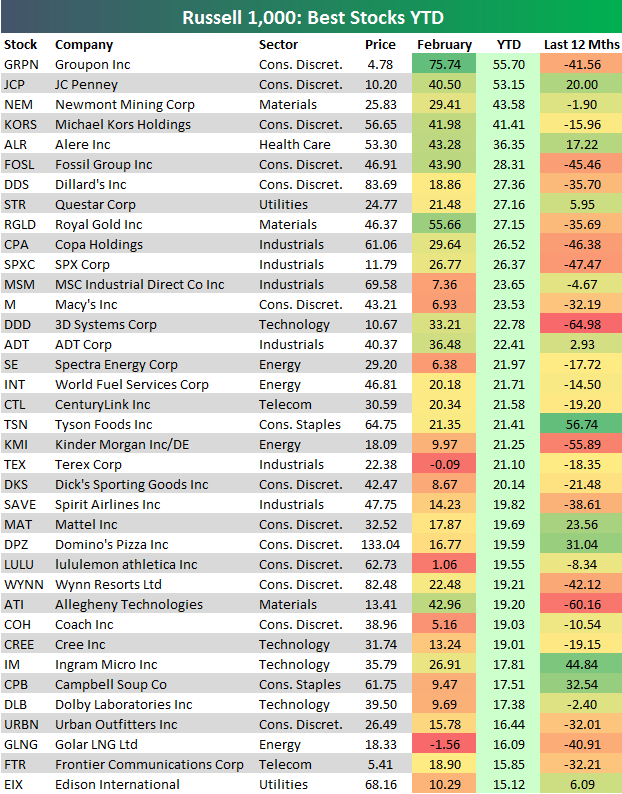
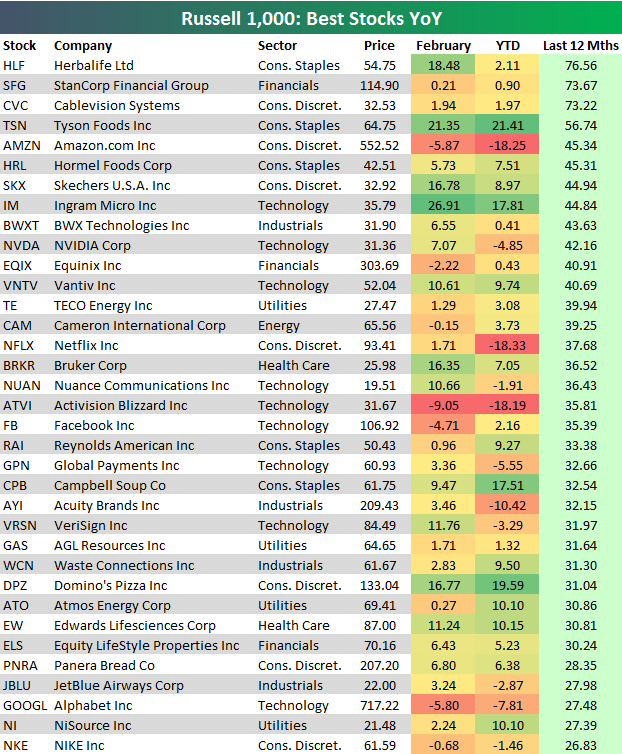
Best Performing Russell 1,000 Stocks Year-to-Date and Year-over-Year
We covered the best and worst performing stocks in February in our prior post, but below we wanted to highlight the stocks that have done the best year-to-date so far in 2016 as well as the stocks that have done the best over the last 12 months.
Groupon (GRPN) was the top performing stock in February, and it’s also the top performing stock year-to-date with a gain of 55.7%. JC Penney (JCP) ranks second, followed by Newmont Mining (NEM), Michael Kors (KORS) and Alere (ALR). Other retailers like Dillard’s (DDS), Macy’s (M), Dick’s Sporting Goods (DKS), Lululemon (LULU) and Coach (COH) are also on the list of 2016’s biggest winners. After underperforming significantly in 2015 even as oil prices were plummeting, retail stocks have recovered to start 2016.
While Groupon (GRPN) is the top performing stock year-to-date, another heavily shorted stock that gets plenty of negative press sits atop the list of best performing stocks over the last 12 months — Herbalife (HLF). With a gain of 76.56%, HLF is up more than any other Russell 1,000 stocks since the end of February 2015. Other notables on this list include Amazon.com (AMZN) with a YoY gain of 45.34%, Netflix (NFLX) at +37.68%, Facebook (FB) at +35.39%, Panera (PNRA) at +28.35%, Alphabet (GOOGL) at +27.48%, and Nike (NKE) at +26.83%.
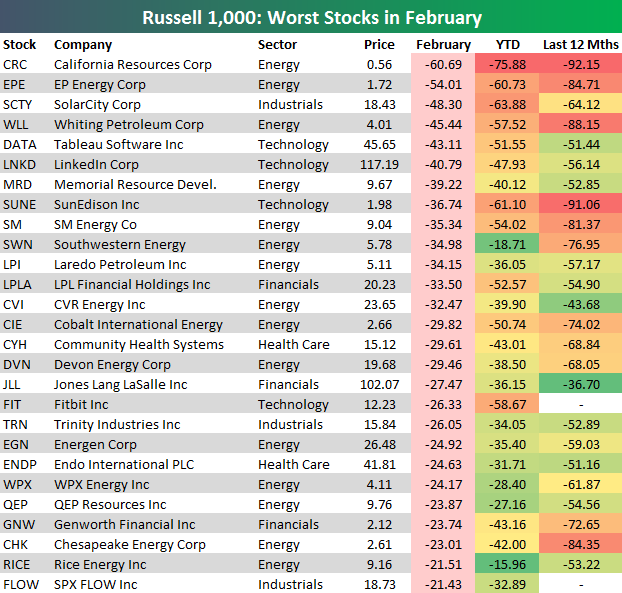
Best and Worst Performing Stocks in February
Below is a list of the best performing Russell 1,000 stocks in the month of February. All of the stocks listed were up more than 20% during the month. As shown, Groupon (GRPN) led the way higher with a gain of 75.74%! After being beaten down for months and months and months, the stock has finally caught a bid in 2016. How long it lasts, who knows? Behind GRPN is Freeport-McMoRan (FCX) with a gain of 65.87%, Royal Gold (RGLD) at +55.66%, and Fossil Group (FOSL) at +43.9%. Other notables on the list of big winners in February include retailers Michael Kors (KORS) and JC Penney (JCP), 3D Systems (DDD), US Steel (X), Alcoa (AA), Wynn (WYNN) and FireEye (FEYE). It was a bounce-back month for the stocks that had previously been hit the hardest.

We covered the winners above, now on to the losers. The stocks below fell 20% or more in February. California Resources (CRC) fell the most at -60.69%, followed by EP Energy (EPE), SolarCity (SCTY), Whiting Petroleum (WLL) and Tableau Software (DATA). LinkedIn (LNKD) was the sixth-worst performer in February with a drop of 40.8%.
The Closer 2/29/16 – “Oil Divergence, Shareholder Yield, ISM Projections”
Looking for deeper insight on global markets and economics? In The Closer tonight we look at the reliability of using early-release manufacturing surveys to forecast the ISM. We also discuss the signal in shareholder yield valuation, and summarize divergence under way between fixed income and oil.
The Closer also includes its standard charts, large volume and price movers in the US equity market, and Bespoke’s Market Timing Model. The Closer is one of our most popular reports, and you can sign up for a trial below to see it free for the next two weeks!
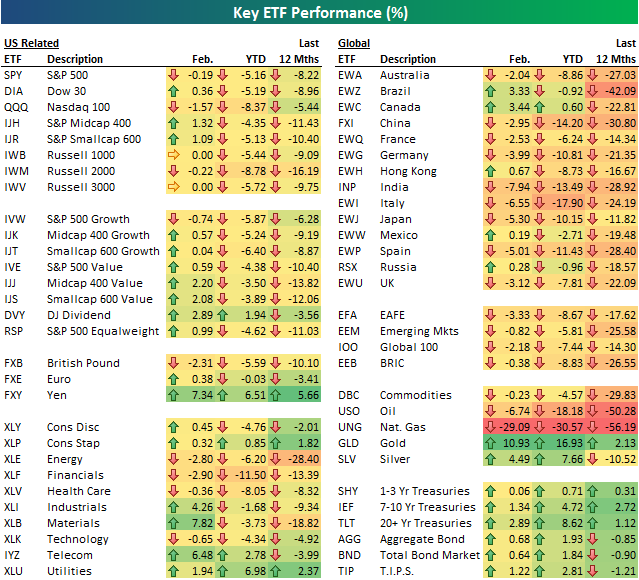
[thrive_leads id=’58717′]Key Asset Class Performance: February, Year-to-Date and Last 12 Months
The first two months of 2016 have now come and gone, and below we provide a nice snapshot of how various asset classes have performed this year using key ETFs traded on U.S. exchanges. For each ETF, we include its February, year-to-date, and year-over-year percentage change. ETFs on the left side of the matrix are mostly U.S. equity related, while ETFs on the right represent international equities, commodities and fixed income.
In February, the largecap S&P 500 (SPY) closed down 19 basis points, but we saw value ETFs gain 2%+. Of the ten sectors, Materials, Industrials and Telecom posted nice gains, while Energy, Financials, Health Care and Technology finished in the red. Outside of the U.S., India, Italy, Japan and Spain finished down 5%+, while Brazil and Canada were up 3%+. Looking at commodities, gold and silver both posted big gains, oil was down 6%, and the natural gas ETF (UNG) fell 29%! Treasury ETFs were up across the board.
Year-to-date, the S&P 500 (SPY) remains down more than 5%, and it’s down 8.22% over the last year. While the U.S. is down slightly less than 10% since last February, have a look at the performance of the international equity ETFs over the last year in the right column. Many countries are sitting on year-over-year declines of 20%+.
Start a 14-day free trial today to get more research from Bespoke. No credit card is required.
One Percenters On The Rise
Two months are now in the books, and what an eventful two months it has been! Over the course of 2016’s 39 trading days, there have now been 23 days where the S&P 500 has had a daily gain/loss in excess of 1%. This is extremely high by historical standards, and there have only been seven other years in the history of the S&P where the index saw more than 20 one-day moves of at least 1% in the first two months of the year. Only two of those seven (1932 and 2009) have exceeded this year’s total. Obviously, the rest of those two years had vastly different outcomes (1932: -17%, 2009: +52%), so to try and read anything into how the market played out then to how it will play now is a worthless endeavour.
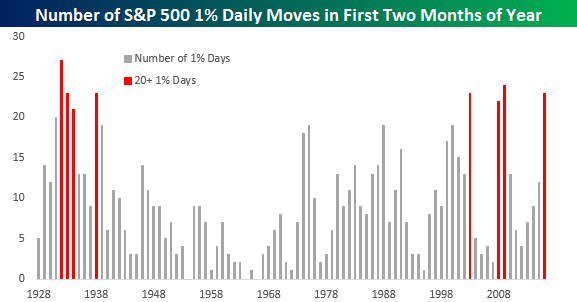
Chart of the Day – All or Nothing Days Near Record High to Start a Year
In today’s Chart of the Day, we take a look at the frequency of all or nothing days in the S&P 500 so far this year and compare this year’s total to prior years since 1990.
To continue reading our Chart of the Day, enter your info below and start a free Bespoke research trial. During your trial, you’ll also receive access to our model stock portfolios, daily market alerts, and weekly Bespoke Report newsletter.
[thrive_leads id=’59052′]
B.I.G. Tips – March 2016 Seasonality
ETF Trends: International – 2/29/16
Dogs of the Dow Strong So Far in 2016
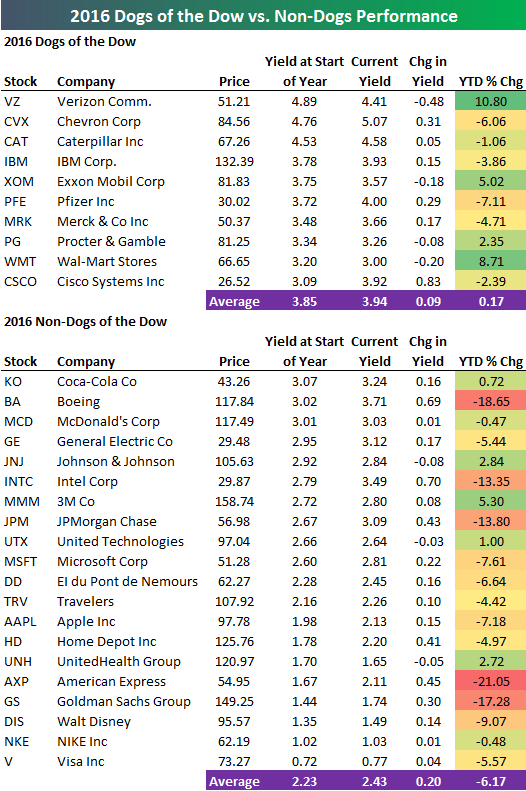
We’re two months into 2016, and one of the key trends so far this year has been the outperformance of value stocks over growth stocks. Higher dividend paying stocks in general have outperformed low or no dividend paying stocks, and that has certainly shown in the performance of 2016’s Dogs of the Dow members.
If you’re unfamiliar with the Dogs of the Dow strategy, it’s a very passive, hands-off investment approach that says to simply buy the ten highest yielding Dow stocks at the start of each year. Below is a table showing the year-to-date performance of this year’s Dogs of the Dow plus the twenty non-Dogs. As shown, the average change of the ten Dogs is actually in positive territory at +0.17%, so if you owned this strategy, you’d be outperforming the market by quite a bit already. The twenty Dow members that aren’t Dogs for 2016 are down an average of 6.17% year-to-date, with Boeing (BA), Intel (INTC), JP Morgan (JPM), American Express (AXP) and Goldman Sachs (GS) all down 10%+. Pfizer (PFE) is the worst performing Dog with a YTD decline of just 7%.
A couple of other things to note. CVX is now the highest yielding stock in the Dow at 5.07%. Cisco (CSCO) has seen its yield jump from 3.09% at the start of the year to 3.92% now after it raised its quarterly payout by 5 cents/share earlier this month. It now yields the same amount as IBM. Finally, if we were to re-shuffle the Dow at this point, Wal-Mart (WMT) and Procter (PG) would come out of the Dogs and Boeing (BA) and Intel (INTC) would be added. But the re-balance only occurs at the start of each year, and these numbers will continue to shift all year.