Bespoke CNBC Appearance (3/2)
Bespoke’s Paul Hickey appeared on CNBC’s Fast Money on Wednesday to discuss the Dogs of the Dow and the broader strategy of dividend investing. To view yesterday’s segment, please click on the image below.
Bullish Sentiment Barely Budges
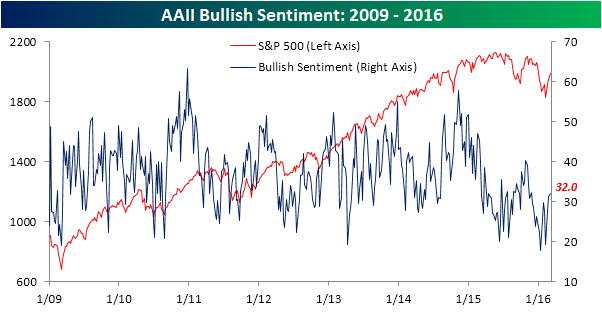
In spite of a nice rally for equities over the last week, individual investor sentiment barely budged higher. In the latest poll of investor sentiment from AAII, bullish sentiment rose from 31.2% up to 32.0%. That’s the 18th straight week where bullish sentiment has been below 40%, and even more amazingly, it is the 52nd week in the last 53 where bullish sentiment has been below 40%. In the history of the AAII survey, there has never been a stretch where we saw more sub-40% readings over a 53-week period.
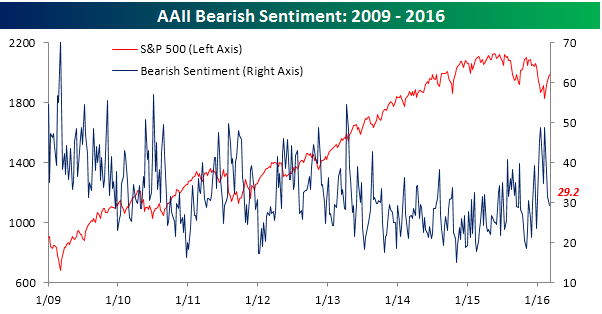
As bullish sentiment has been slowly creeping higher, bearish sentiment has been steadily drifting lower. In this week’s survey, bearish sentiment dropped from 31.4% down to 29.2%. This was the third straight weekly decline, and now puts bearish sentiment at its lowest level of the year.
Jobless Claims Jump
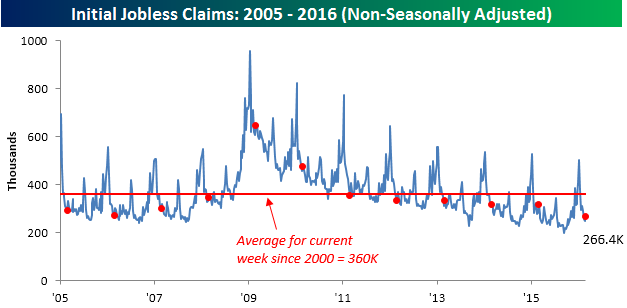
Jobless claims this week jumped to their highest levels of February. While economists were forecasting first-time claims to drop by 2K down to 270K, the actual reading came in at 278K. As shown in the chart below, claims are now right back at that uptrend line they broke to the downside at the start of February. That being said, as long as claims can stay below 300K (as they have been for the last 52 weeks) and not see a sharp spike higher, these levels are positive.
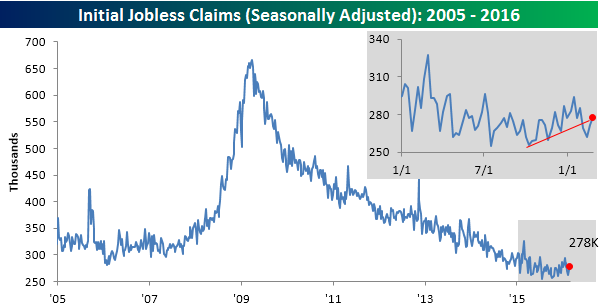
Although claims rose for the second week in a row, the four-week moving average fell from 272K down to 270.25K. This is the lowest level for the 4-week average since late November, but unless claims dip below 270K next week, this measure will start to rise again. The cycle low of 259.25K for the 4-week moving average was back in October, and that may be a low that holds for quite some time.

On a non-seasonally adjusted (NSA) basis, claims rose from 248.9K up to 266.4K. That being said, for the current week of the year, NSA claims are over 90K below their average since 2000.
The Closer 3/2/16 – “Oceans of Oil, Production Precarious, VIX Loses Vantage”
Looking for deeper insight on global markets and economics? In The Closer this evening we look at oil inventories, demand, and production, as well as price action following a massive inventories print that led to a counter-intuitive rally later in the day. We also take a look at the plunging VIX index before recapping today’s Fed Beige Book.
The Closer also includes its standard charts, large volume and price movers in the US equity market, and Bespoke’s Market Timing Model. The Closer is one of our most popular reports, and you can sign up for a trial below to see it free for the next two weeks!
[thrive_leads id=’58717′]Just One Sector Remains Below Its 50-DMA: Health Care
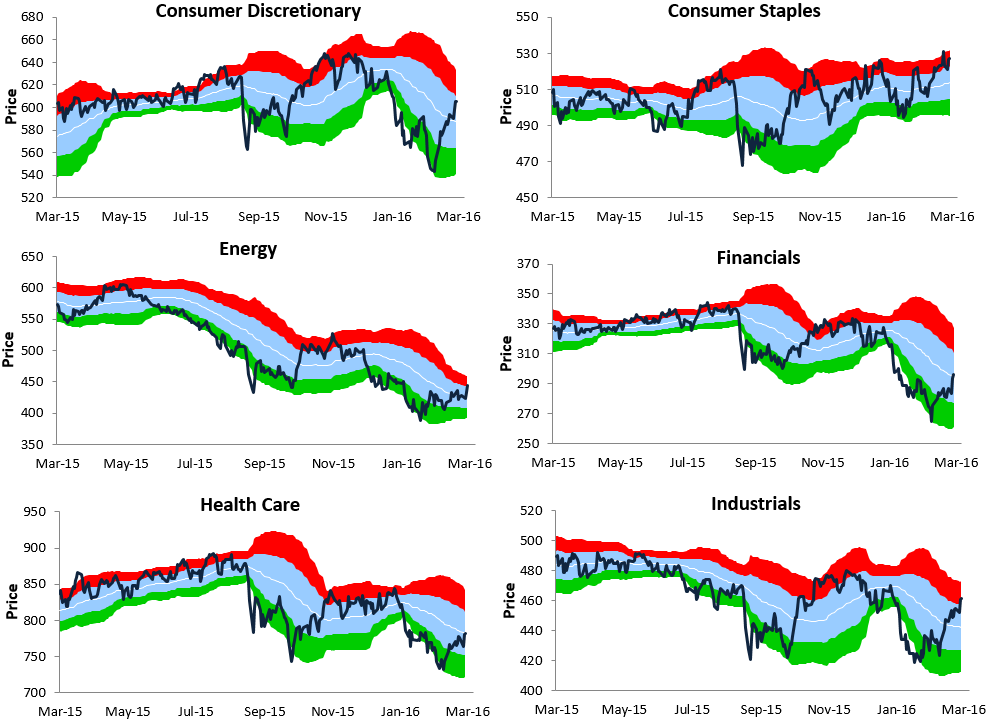
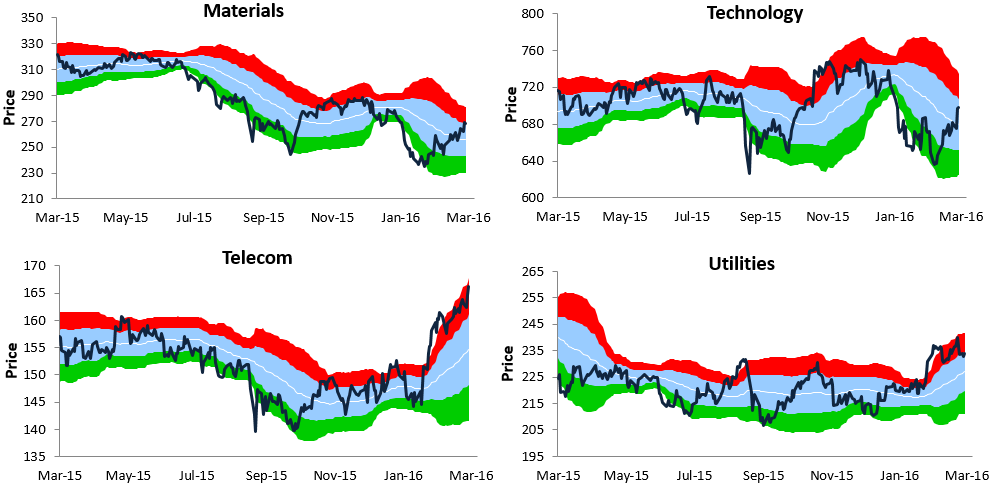
The Financial sector broke back above its 50-day moving average today, leaving just one more of the ten sectors still below its 50-day — Health Care. But Health Care is right on the cusp of a break back above its 50-day as well, which you can see in our trading range screen of the ten sectors below. The black vertical “N” line represents each sector’s 50-day moving average.
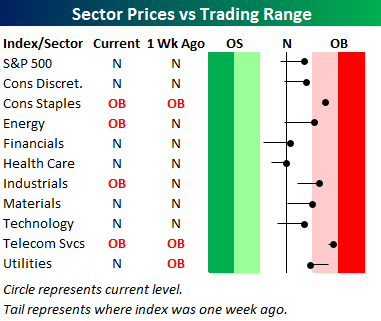
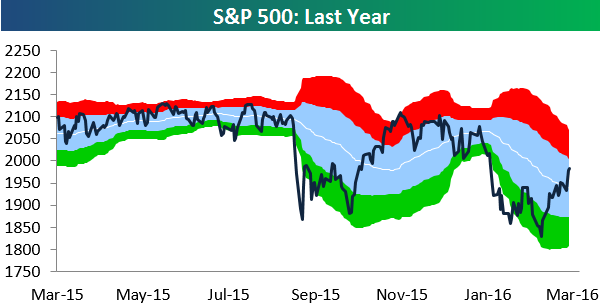
Below are one-year Bespoke trading range charts of the S&P 500 and its ten sectors. While all but one sector is back above its 50-day, the majority of them remain in longer-term downtrends. Consumer Staples, Telecom and Utilities — all defensives — are the only sectors not in downtrends.
If you’re interested in sector analysis, we cover these charts plus more in our weekly Sector Snapshot due out tomorrow.
Bespoke’s George Pearkes on Bloomberg TV
Please click the thumbnails below to view segments from Bloomberg TV’s What Did You Miss? on March 1st featuring Bespoke’s George Pearkes.


Losers Bounce
The average S&P 500 stock is up more than 10% since the close on February 11th. From the start of the year through February 11th, though, the average stock in the index fell more than 10%. Below we have broken up the S&P into deciles (10 groups of 50 stocks each) based on stock performance from the start of the year through February 11th. We then calculated the average performance of stocks in each decile since February 11th. As shown, the 50 stocks that did the worst during the market’s correction from January 1st through February 11th are up an average of 17.7% since then, while the 50 stocks that held up the best during the market’s correction are up an average of just 3.8%! Clearly this has been a “buy the losers” rally, and it helps show why active managers have such a tough time beating the market.
