ETF Trends: International – 7/12/17
Natural Gas, Semiconductors, and Solar are this week’s most notable outperformers in the universe of ETFs that we track. A multitude of countries have also made solid gains over the past week, such as Turkey, Mexico, and China. On the other hand, Retail has become a regular underperformer as of late, surrounded by Telecoms, Vietnam, and Coffee.

Bespoke provides Bespoke Premium and Bespoke Institutional members with a daily ETF Trends report that highlights proprietary trend and timing scores for more than 200 widely followed ETFs across all asset classes. If you’re an ETF investor, this daily report is perfect. Sign up below to access today’s ETF Trends report.
See Bespoke’s full daily ETF Trends report by starting a no-obligation free trial to our premium research. Click here to sign up with just your name and email address.
Bespoke’s Country Trading Range Screen — 7/12/17
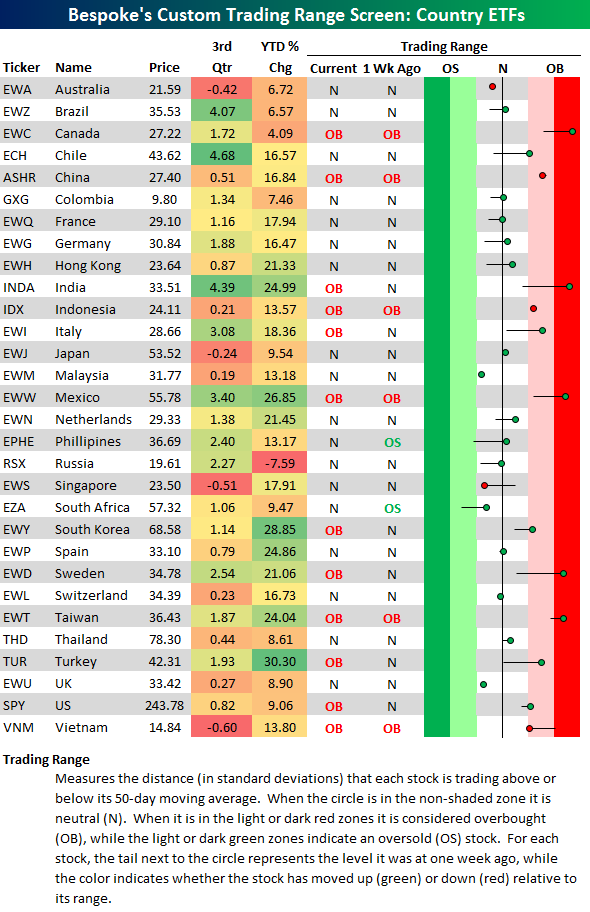
Below is an updated look at our trading range screen for 30 of the largest country ETFs traded on US exchanges. So far in the third quarter (which is just 7 trading days old at this point), the average change of the 30 ETFs listed is +1.43%. Year-to-date, the average ETF is up 15.37%.
In the trading range section on the right side of the matrix, the black vertical “N” line represents each ETF’s 50-day moving average. The dot represents where each country is currently trading relative to its 50-day, while the tail end represents where it was trading one week ago. Last week at this time, a number of countries were trading below their 50-days, but many of them have rallied back to trade above their 50-days this week.
While no countries are trading in oversold territory at the moment, twelve of the thirty are now trading in overbought territory. Canada (EWC), India (INDA), Mexico (EWW), Sweden (EWD), and Taiwan (EWT) are at the most extreme overbought levels.
Year-to-date, Russia (RSX) is the only ETF in the screen that is in the red, while Turkey (TUR), South Korea (EWY), and Mexico (EWW) are up the most at 26%+.
Click here to start a no-obligation two-week free trial to our premium research platform.
Fixed Income Weekly – 7/12/17
Searching for ways to better understand the fixed income space or looking for actionable ideals in this asset class? Bespoke’s Fixed Income Weekly provides an update on rates and credit every Wednesday. We start off with a fresh piece of analysis driven by what’s in the headlines or driving the market in a given week. We then provide charts of how US Treasury futures and rates are trading, before moving on to a summary of recent fixed income ETF performance, short-term interest rates including money market funds, and a trade idea. We summarize changes and recent developments for a variety of yield curves (UST, bund, Eurodollar, US breakeven inflation and Bespoke’s Global Yield Curve) before finishing with a review of recent UST yield curve changes, spread changes for major credit products and international bonds, and 1 year return profiles for a cross section of the fixed income world.
In this week’s note, we review which global bond markets are the biggest drivers of the US (and vice-versa) using a statistical test.

Our Fixed Income Weekly helps investors stay on top of fixed income markets and gain new perspective on the developments in interest rates. You can sign up for a Bespoke research trial below to see this week’s report and everything else Bespoke publishes free for the next two weeks!
Click here to start your no-obligation free Bespoke research trial now!
Time For the Nasdaq to Put Up or Shut Up
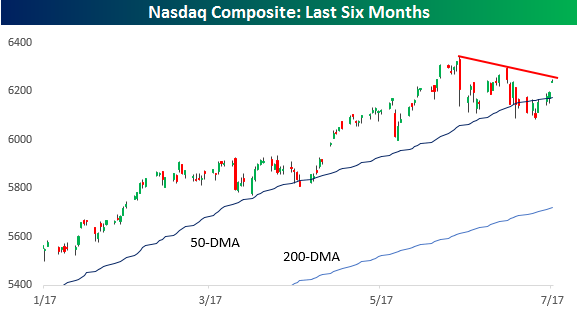
After falling nearly 4% from its all-time high, the Nasdaq is on pace to string together its fourth straight day of decent gains. To put that in perspective, the last time the index was up 0.25% or more for at least four days was in February. From a technical perspective, how the Nasdaq follows up today’s early strength will have a big impact on technical sentiment in the near term. As shown in the chart below, in early trading today, the Nasdaq is hovering just under the downtrend that has been in place from that high from early June. If it can continue to rally above that trendline, it would be a bullish sign, but a second lower high here would really weaken the picture in the short-term.
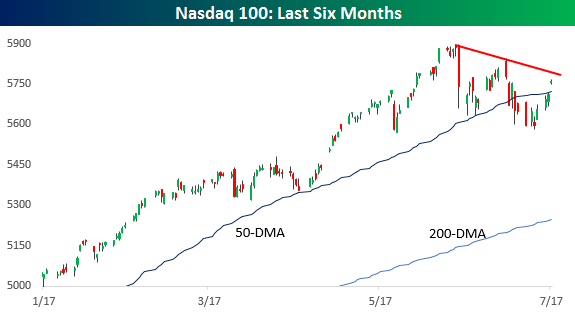
Like the broader Nasdaq, the Nasdaq 100, which is more heavily weighted towards the FANG stocks, saw a much larger decline than the Nasdaq from its peak (-5.4%). Like the Nasdaq, it has also rebounded decently from those lows. That said, it still has a bit more wood to chop on the upside before that newly formed downtrend comes into play.
Bespoke CNBC Appearance (7/12/17)
Bespoke co-founder Paul Hickey appeared on CNBC’s Squawk Box on Wednesday morning to discuss markets heading into earnings season. To view the segment, click on the image below.

Bespoke’s Global Macro Dashboard — 7/12/17
Bespoke’s Global Macro Dashboard is a high-level summary of 22 major economies from around the world. For each country, we provide charts of local equity market prices, relative performance versus global equities, price to earnings ratios, dividend yields, economic growth, unemployment, retail sales and industrial production growth, inflation, money supply, spot FX performance versus the dollar, policy rate, and ten year local government bond yield interest rates. The report is intended as a tool for both reference and idea generation. It’s clients’ first stop for basic background info on how a given economy is performing, and what issues are driving the narrative for that economy. The dashboard helps you get up to speed on and keep track of the basics for the most important economies around the world, informing starting points for further research and risk management. It’s published weekly every Wednesday at the Bespoke Institutional membership level.
Click here to start a no-obligation two-week free trial to Bespoke Institutional!

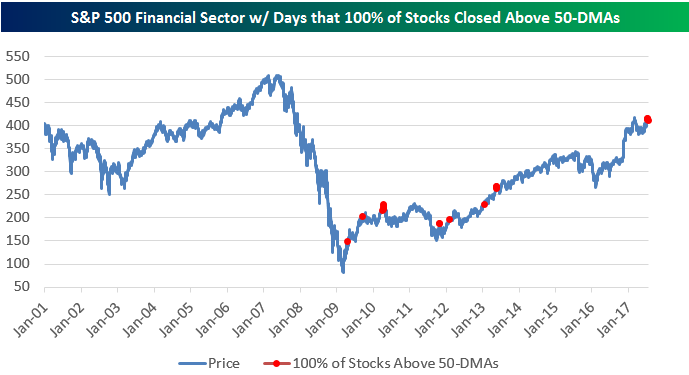
Financial Sector Breadth Hits 100%
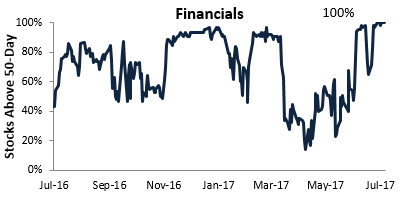
Breadth within the S&P 500 Financial sector has been extremely strong lately. Since 2001 there have been 4,157 trading days, and 100% of Financial sector stocks have closed above their 50-DMAs on just 21 of those trading days (just 0.5% of all days). It’s pretty remarkable that 5 of those 21 days have occurred in the first 6 days of this month!
Click here to start a no-obligation two-week free trial to our premium research platform.
Below is a look at the percentage of stocks in the Financial sector trading above their 50-DMAs over the last year. While the reading got into the high 90s shortly after last November’s Presidential Election, it didn’t hit the 100% mark until this July 3rd.
The chart below shows the price of the S&P 500 Financial sector since 2001 with days where 100% of stocks in the sector closed above their 50-DMAs highlighted in red. The first time it happened was in early 2009 just after the Financial Crisis lows were put in. The last time it happened was more than four years ago in May 2013. This shows how long it has been since we’ve had full participation in the Financial sector.
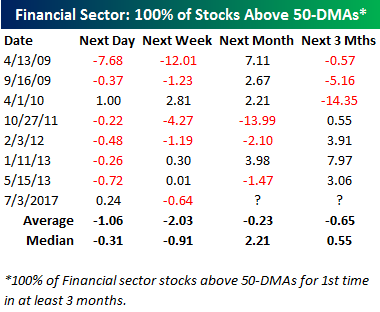
Finally, the table below shows how the Financial sector has performed in the weeks and months ahead after breadth hits 100% like it did recently. Below are the dates since 2001 when 100% of stocks in the Financial sector closed above their 50-day moving averages (without having occurred in the prior three months). At the bottom of the table we show the average and media performance of the sector over the next day, week, month, and three months. The results really don’t show any kind of meaningful trend for forward performance when breadth gets this strong.
The Closer — Big BoC, Survey of Quits — 7/11/17
Log-in here if you’re a member with access to the Closer.
Looking for deeper insight on global markets and economics? In tonight’s Closer sent to Bespoke Institutional clients, we preview the BoC, followed by a summary of quit rates across industries as-of the May JOLTS report released by the BLS today.
The Closer is one of our most popular reports, and you can sign up for a free trial below to see it!
The Closer is one of our most popular reports, and you can see it and everything else Bespoke publishes by starting a no-obligation 14-day free trial to our research!
B.I.G. Tips – Same Headline, Different Quarter: Analysts Still Negative
ETF Trends: US Sectors & Groups – 7/11/17
Semiconductors highlight this week’s list of best performing ETFs that we track, up about 4.5% this week after seeing almost a 4% decrease last week. The rest of our best performers are filled out mostly by countries, most notably Mexico, India, and Latin America. Oil’s struggles continue, with these struggles even larger in magnitude when compared to recent sessions. Other notable underpeformers are Retail, Energy, and Real Estate.

Bespoke provides Bespoke Premium and Bespoke Institutional members with a daily ETF Trends report that highlights proprietary trend and timing scores for more than 200 widely followed ETFs across all asset classes. If you’re an ETF investor, this daily report is perfect. Sign up below to access today’s ETF Trends report.
See Bespoke’s full daily ETF Trends report by starting a no-obligation free trial to our premium research. Click here to sign up with just your name and email address.