Dow 30 Trend Analyzer; 10 Overbought, 3 Oversold
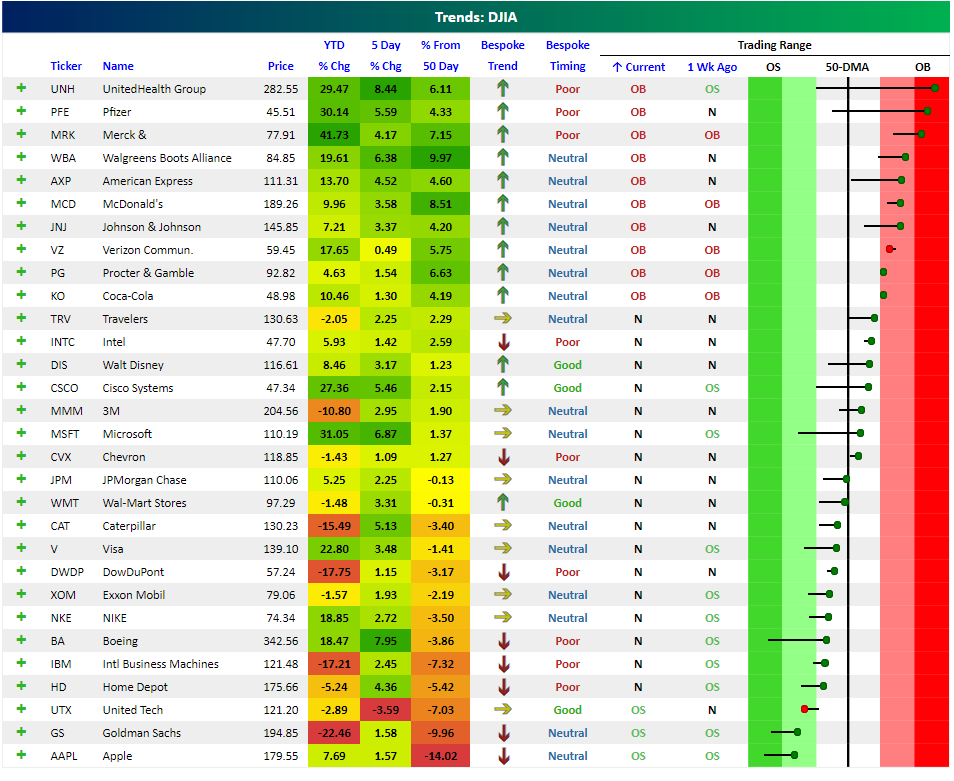
While the Dow Jones Industrial Average remains below its 50-day moving average, we’re seeing some internal strength that’s worth pointing out. As shown in our Trend Analyzer snapshot of the Dow 30 members below, 10 stocks are currently overbought while just 3 are oversold. This means that 10 stocks are trading more than one standard deviation above their 50-day moving averages, while 3 are more than one standard deviation below their 50-DMAs. The only 3 stocks that are oversold are United Tech (UTX), Goldman Sachs (GS), and Apple (AAPL).
In addition, more than half of the Dow 30 are trading above their 50-day moving averages, which is another sign of positive underlying breadth.
The most overbought stock in the Dow right now is UnitedHealth (UNH), followed by Pfizer (PFE), and Merck (MRK). All three of these stocks are trading in what we call “extreme” overbought territory — more than 2 standard deviations above their 50-day moving averages.
For UNH, the stock has moved from trading oversold one week ago at this time to trading extremely overbought. Talk about a sharp reversal higher!
Trend Analyzer – 11/30/18 – Powell Surge Not Offset
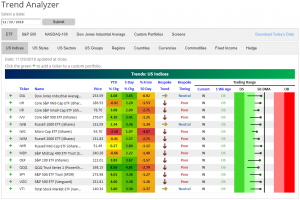
Comments by Fed Chair Powell sent equity markets surging on Wednesday. Since then, markets have seen a fair amount of red with most major indices declining yesterday and looking to open lower again this morning. Since these declines have not been steep enough to offset the gains from earlier in the week, every ETF that tracks the major US Indices remains neutral and still up from one week ago. One day of big gains would likely push them back above their 50-day moving averages as well, which would be a positive technical development.
Bespoke Morning Lineup – Ten Year Yield Remains Anchored
US equity futures are lower heading into the open, but we’ve seen a real rebound in the last few minutes, and now futures are only indicating the slightest of negative opens as we close out the last trading day of the month. Read today’s Bespoke Morning Lineup below for major macro and stock-specific news events, updated market internals, and detailed analysis and commentary:
Bespoke Morning Lineup – 11/30/18
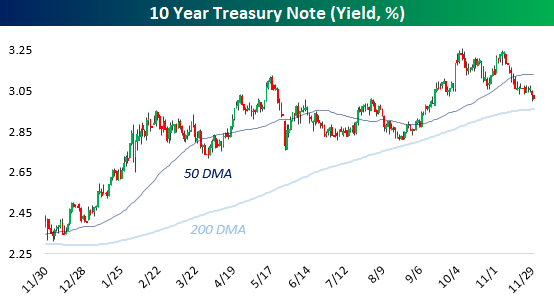
Strong performance of US duration has continued with another day of bull flattening. Granted, the long end of the curve is down less than 2 bps on the day, but that’s still enough to put rates at a 10-week low. Notably, the 50-DMA looks like its starting to roll over and the 200-day is also slowing. There’s no trend shift yet for 10s, but given dour sentiment on the global economy and a less hawkish Fed, anything is possible.
Start a two-week free trial to Bespoke Premium to see today’s full Morning Lineup report. You’ll receive it in your inbox each morning an hour before the open to get your trading day started.

The Closer — Sector Dispersion, Crude Vol Reversion, GBP Aversion, PCE Occlusion — 11/29/18
Log-in here if you’re a member with access to the Closer.
Looking for deeper insight on markets? In tonight’s Closer sent to Bespoke Institutional clients, we take a look at dispersion within S&P 500 sectors, the horrible run for the Mexican stock market that saw a reprieve of 3% gains today, extreme moves in the oil volatility markets, elevated risk premiums for GBP but less so for other GBP-denominated markets, and finally a recap personal income and spending numbers today from BEA (including much softer inflation numbers).

See today’s post-market Closer and everything else Bespoke publishes by starting a 14-day free trial to Bespoke Institutional today!
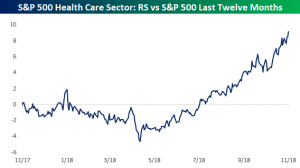
Health Care Going Strong
The Health Care sector has been on an impressive run this year. While not immune from the downturn this Fall, it has recovered nicely with exceptional relative strength. We update sector relative strength charts each week in our Sector Snapshot report to compare the performance of the various sectors relative to the broader market. Heading into the final month of the year, Health Care is outperforming the S&P 500 by an enormous margin. Granted it had been in a solid uptrend since the spring, but with the S&P 500 seeing a substantial amount of red since the peak on September 20th, it comes as no surprise that investors would flock to a more defensive sector.
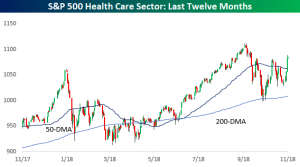
Although Health Care’s relative strength may not jump out when looking at the sector’s price chart, the pattern forming since the broader market peak looks promising. Since bottoming in late October, Health Care came back to test resistance at around 1,080. After failing that test, it pulled back making a higher low, and with another day of gains today, it has finally broken out above former resistance.
In the table below, we highlight the 24 stocks within the Health Care sector that are up since the S&P 500’s closing high on 9/20. Cigna (CI) has been the best performer during this time rising 10.83%. Right on CI’s heels are Eli Lilly (LLY) and Merck (MRK) which have also both seen double-digit gains. While the same cannot be said for Cigna, LLY and MRK have also seen extraordinary gains YTD. HCA Healthcare (HCA) has the second-best growth YTD at 65.54% and also ranks the fourth best since the peak.
![]()
Bespoke’s Sector Snapshot — 11/29/18
Bespoke Summary of Economic Indicators: 11/29/18
Chart of the Day: Claims Under Control?
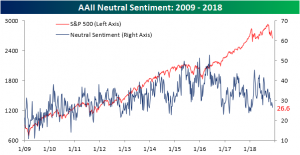
Individual Investors Turn Positive
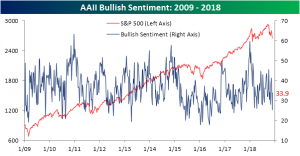
The AAII survey on individual investor sentiment released this morning saw a more positive turn after last week’s extremely bearish reading. The post-Thanksgiving gains experienced so far this week helped to boost sentiment to 33.88% from last week’s low 25.25%. This is slightly lower than what we have seen most of the year, but much more in line with recent months.
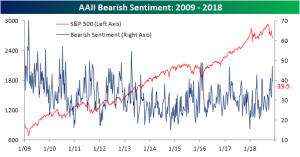
Last week saw the highest reading for bearish sentiment since February 2016. Bearish sentiment for this week fell to 39.5% from 47.1%. While this is certainly a large drop, it is still at an elevated level that hasn’t been seen since the spring.
Neutral sentiment saw a small decline from 27.61% to 26.64% with this loss most likely going towards the bullish camp.
Important to note about this week’s survey is that the impact of Fed Chair Powell’s remarks are likely to not be seen due to timing. With the speech occurring mid-day yesterday, most respondents had already reported. If yesterday’s price action in response to the speech is any indication, we should expect to see some fairly large changes benefiting bullish sentiment in next week’s survey. Also between now and then will be the G20, and more importantly, the meeting between President Trump and Chinese President Xi Jinping. This is yet another would-be catalyst that investors are watching as a tell on where trade policy will go. Some type of agreement between the two presidents could supplement the probable increase in bullish sentiment next week.
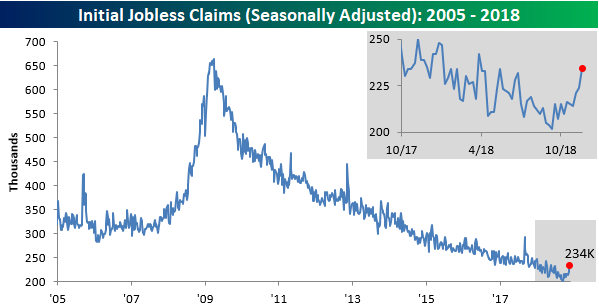
Jobless Claims Hit a Six-Month High
Six-month high for jobless claims? That’s something we haven’t been able to say in well over a year since hurricanes battered the US late last summer. Today’s report on jobless claims showed an increase to 234K from last week’s level of 224K and expectations for 220K. The last time claims were this high was back in mid-May, and the last time they were higher was in late March! For years now, any time the strength and resiliency of the US economy has come into question, the downward trend of jobless claims has acted as a security blanket. After today’s report, though, the yarn may be starting to fray a little. Even at 234K, claims are still low by historical standards, but they are just higher than what we have become accustomed to in recent months.
This week’s reading of 234K ended the streak of weeks where claims were at or below 225K at 20, which was just two shy of the 22-week record in 1969. While that streak has ended, the 60-week streak of readings at or below 250K remains intact, as does the record streak of 195 straight weeks where claims have been at or below 300K. When and if these streaks start to fall, it will be a time of much greater concern.
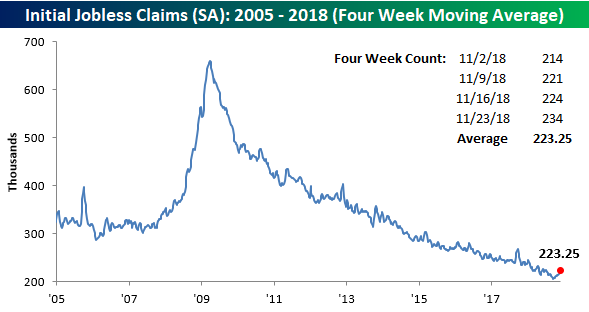
The four-week moving average also saw a pretty sizable increase this week, rising from 218.5K up to 223.25K. That 4.75K increase is the largest since mid-May, which was also the last time weekly claims were this high. It has now been eleven weeks since this indicator made its last cycle low of 206K, and the last time we were this far off a low was in September 2017.
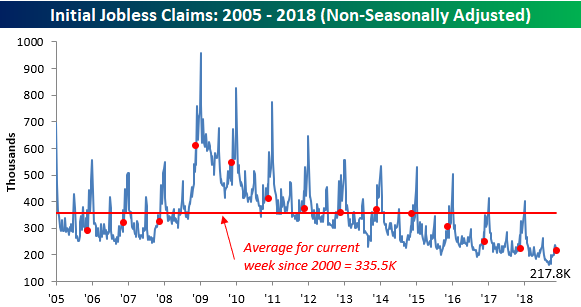
With this week’s report covering the week of Thanksgiving and the prior week being Veterans Day, there is some talk that the numbers this week may have been skewed a bit. Only time will tell on that front, but we would note that on a non-seasonally adjusted (NSA) basis, claims were not as bad. At 217.8K, this week’s NSA reading was nearly 140K below the average for the current week of the year dating back to 2000, and the last time they were this low in this specific week was in 1968.