2019 Outlook — Market Cycles
Our 2019 Bespoke Report market outlook is the most important piece of research that Bespoke publishes each year. We’ve been publishing our annual outlook piece since the formation of Bespoke in 2007, and it gets better and better each year! In this year’s edition, we’ll be covering every important topic you can think of dealing with financial markets as we enter 2019.
The 2019 Bespoke Report contains sections like Washington and Markets, Economic Cycles, Market Cycles, The Fed, Sector Technicals and Weightings, Stock Market Sentiment, Stock Market Seasonality, Housing, Commodities, and more. We’ll also be publishing a list of our favorite stocks and asset classes for 2019 and beyond.
We’ll be releasing individual sections of the report to subscribers until the full publication is completed by year-end. Today we have published the “Market Cycles” section of the 2019 Bespoke Report, which focuses on market performance during the late stages of bull markets, in bear markets, as well as corrections.
To view this section immediately and all other sections, sign up for our 2019 Annual Outlook Special!
2019 Outlook Report — Valuation
Our 2019 Bespoke Report market outlook is the most important piece of research that Bespoke publishes each year. We’ve been publishing our annual outlook piece since the formation of Bespoke in 2007, and it gets better and better each year! In this year’s edition, we’ll be covering every important topic you can think of dealing with financial markets as we enter 2019.
The 2019 Bespoke Report contains sections like Washington and Markets, Economic Cycles, Market Cycles, The Fed, Sector Technicals and Weightings, Stock Market Sentiment, Stock Market Seasonality, Housing, Commodities, and more. We’ll also be publishing a list of our favorite stocks and asset classes for 2019 and beyond.
We’ll be releasing individual sections of the report to subscribers until the full publication is completed by year-end. Today we have published the “Valuation” section of the 2019 Bespoke Report, which focuses on how the market and individual sectors look now on a valuation basis relative to recent and very long-term historical averages.
To view this section immediately and all other sections, sign up for our 2019 Annual Outlook Special!
B.I.G. Tips – Clicks Carry Retail Sales
Trend Analyzer – 12/14/18 – More of the Same
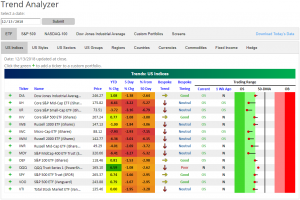
This morning our Trend Analyzer is largely unchanged as the major indices closed flat yesterday. Whereas headed into the end of last week most of the major index ETFs had moved out of oversold to neutral, this week only the Nasdaq (QQQ) has remained neutral. All other ETFs are oversold as they have been most of the week. Small and mid caps have been the worst performers in the past week. The S&P MidCap 400 (MDY) has declined the most at 3.27% while the Core S&P Mid-Cap (IJH) and Core S&P Small-Cap (IJR) are not far behind also seeing losses of over 3%. .
Morning Lineup – Growth Makes a Comeback
The phrase of the day around the world heading into 8:30 was weak economic data, as a bevy of weaker than expected economic data points flooded the headlines. The just-released November Retail Sales report, however, tried to buck that trend as it not only came in higher than expected, but last month’s report was also revised higher! There’s still more to come, though, with Industrial Production and Capacity Utilization at 9:15 and Flash PMI from Markit at 9:45, so hopefully that trend can continue (but not too strong!). Read today’s Bespoke Morning Lineup below for major macro and stock-specific news events, updated market internals, and detailed analysis and commentary:
Bespoke Morning Lineup – 12/14/18
Back in late September when the S&P 500 peaked and started to correct, growth stocks were hit hard reversing their trend of outperformance from earlier in the year. The culprit? Concerns over tighter FOMC policy. By mid-November, the S&P 500 Growth Index had given up about half of its YTD outperformance relative to the S&P 500 Value since the start of the year. Over the last three to four weeks, though, growth stocks have regained some steam with a strong three weeks of relative outperformance. This latest leg lower for the group has come as concerns over broader economic growth have increased causing the market to rethink expectations for the pace of rate hikes going forward.

Start a two-week free trial to Bespoke Premium to see today’s full Morning Lineup report. You’ll receive it in your inbox each morning an hour before the open to get your trading day started.

Bespoke’s Sector Snapshot — 12/13/18
Tariff Trouble: Treasury’s Tales
Today, the US Treasury reported monthly budget numbers for November. In addition to data about aggregate outlays, revenues, and the deficit, there’s also some interesting data under the hood. Since the US started down a more protectionist policy path following the 2016 Presidential election, we’ve kept a close eye on the line item for customs duties, where the Treasury reports the collection of tariffs (import taxes). This series didn’t start moving much until Q1 of this year, when new taxes on steel, aluminum, and Chinese goods started to really kick in. In the three months ended February, average customs duty revenues ran at a pace of about $3bn (after seasonal adjustment), or $36bn SAAR. By August that number was nearly $4bn, and in November it was nearly $6bn. On a 3m average basis, September-November saw customs duties collected at a pace of 30 bps of GDP. Historically (since this data series begins in 1998) that number typically runs between 15 and 20 bps of GDP, so relative to the size of the economy import tariffs are nearly twice their historic range. Of course, these are still small numbers relative to the total economy. They’re also small relative to US imports, with the September-November period showing customs duties running a bit over 2.3% of total goods import values. Over the last 20 years or so, that number has typically been more around 1.5%. In other words, the tax rate on imports has risen very sharply, but it’s still very small relative to, for example, sales taxes in most states.

Chart of the Day: European Equities Underperform
Jobless Claims Beat Estimates By 20K
After nearly two months of trending upwards, initial jobless claims fell dramatically this week to 206K versus last week’s 231K on a seasonally adjusted basis. This low reading is only 4K off of the multi-decade low of 202K from mid-September, and at 40 year lows for all but three readings from the last week of August and first two weeks of September. Claims were expected to decline this week, but the actual reading blew the 226K forecast out of the water; this was the largest beat since April. This week’s release has of course held onto a number impressive streaks. They have now spent 62 weeks below 250K, the best streak since January 1970 when the streak ended at 89 weeks. Claims have also held below 300K for a record 197 weeks. Given population and employment trends since the previous records, these current streaks are arguably a lot more impressive. Following the previous several weeks’ elevated levels, this week’s low reading helps to reaffirm the health of these streaks.
Taking a look at the four-week moving average, this week’s data point is still unconcernedly elevated but below levels last week. The four-week moving average comes in at 224.75K, down from last week’s 231K. While it is still at very low levels in the grand scheme of things and should be no cause for concern, it has now been 13 weeks since the last time it made a cycle low.

On a non-seasonally adjusted basis, initial claims fell off of last week’s highs down to 260.5K. This drop is in line with seasonal patterns that have been previously observed. Important to note, this week of the year typically comes before a major spike in claims and this dip off highs has happened in prior instances (can be seen in the past two years in the chart below). In other words, while this week was remarkably strong, it could come in part from seasonal factors and in upcoming releases, especially on a non-seasonally adjusted basis, there could be a higher reading due to seasonal effects. Regardless, today’s data maintains a healthy labor market and came in well below the average for the current week in the past 18 years of 439.7K and since 2005 there has not been a better week for initial jobless claims.

Individual Investor Sentiment Hits Multi-Year Records
As we made note of last week, the survey of individual investor sentiment from AAII saw a surprising divergence from the market’s price action due to timing issues of the survey. Last week saw a jump in bullish sentiment despite major declines on Tuesday. This week’s survey was much weaker, with bullish sentiment plunging. It’s now down to 20.9% from 37.9%. As shown in the chart below, this reading of 20.9% collapsed well below lows of the year and is at the lowest point since May 26, 2016. This was also the third largest WoW drop of the current cycle and the largest since mid-November of 2010 when bullish sentiment fell by only half a percentage point more.
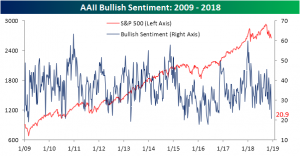
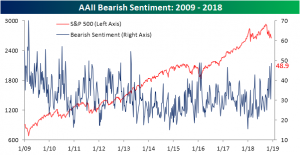
Obviously, if bullish sentiment collapses as it did this week, bearish sentiment sees the inverse effect. Bearish sentiment rose to the highest level in over 5 years to 48.9%; up 18.7% from last week. That is the largest uptick and the highest reading since April 11, 2013! Bearish sentiment is also into a region from early 2016 that saw a major global equity market bottom.
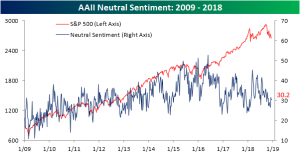
Neutral sentiment actually saw a slight decline this week meaning neutral and bullish investors likely all went into bearish sentiment.