2019 Outlook — Washington
Our 2019 Bespoke Report market outlook is the most important piece of research that Bespoke publishes each year. We’ve been publishing our annual outlook piece since the formation of Bespoke in 2007, and it gets better and better each year! In this year’s edition, we’ll be covering every important topic you can think of dealing with financial markets as we enter 2019.
The 2019 Bespoke Report contains sections like Washington and Markets, Economic Cycles, Market Cycles, The Fed, Sector Technicals and Weightings, Stock Market Sentiment, Stock Market Seasonality, Housing, Commodities, and more. We’ll also be publishing a list of our favorite stocks and asset classes for 2019 and beyond.
We’ll be releasing individual sections of the report to subscribers until the full publication is completed by year-end. Today we have published the “Washington” section of the 2019 Bespoke Report, which discusses the performance of equities based on the political composition in DC and how the current environment is more polarized than it has ever been.
To view this section immediately and all other sections, sign up for our 2019 Annual Outlook Special!
2019 Outlook — Thematic Performance
Our 2019 Bespoke Report market outlook is the most important piece of research that Bespoke publishes each year. We’ve been publishing our annual outlook piece since the formation of Bespoke in 2007, and it gets better and better each year! In this year’s edition, we’ll be covering every important topic you can think of dealing with financial markets as we enter 2019.
The 2019 Bespoke Report contains sections like Washington and Markets, Economic Cycles, Market Cycles, The Fed, Sector Technicals and Weightings, Stock Market Sentiment, Stock Market Seasonality, Housing, Commodities, and more. We’ll also be publishing a list of our favorite stocks and asset classes for 2019 and beyond.
We’ll be releasing individual sections of the report to subscribers until the full publication is completed by year-end. Today we have published the “Thematic Performance” section of the 2019 Bespoke Report, which discusses drivers of relative performance across quantitative strategies, market cap size, volatility markets, tax rate, international revenue exposure, and correlation trading.
To view this section immediately and all other sections, sign up for our 2019 Annual Outlook Special!
2019 Outlook — Credit Markets
Our 2019 Bespoke Report market outlook is the most important piece of research that Bespoke publishes each year. We’ve been publishing our annual outlook piece since the formation of Bespoke in 2007, and it gets better and better each year! In this year’s edition, we’ll be covering every important topic you can think of dealing with financial markets as we enter 2019.
The 2019 Bespoke Report contains sections like Washington and Markets, Economic Cycles, Market Cycles, The Fed, Sector Technicals and Weightings, Stock Market Sentiment, Stock Market Seasonality, Housing, Commodities, and more. We’ll also be publishing a list of our favorite stocks and asset classes for 2019 and beyond.
We’ll be releasing individual sections of the report to subscribers until the full publication is completed by year-end. Today we have published the “Credit Markets” section of the 2019 Bespoke Report, which reviews recent returns, current risk premiums and themes, and implications for equities in the US corporate credit markets.
To view this section immediately and all other sections, sign up for our 2019 Annual Outlook Special!
Chart of the Day – Russell 2000 Bear Markets
Bespoke Stock Scores — 12/18/18
2018 Total Returns Getting Uglier
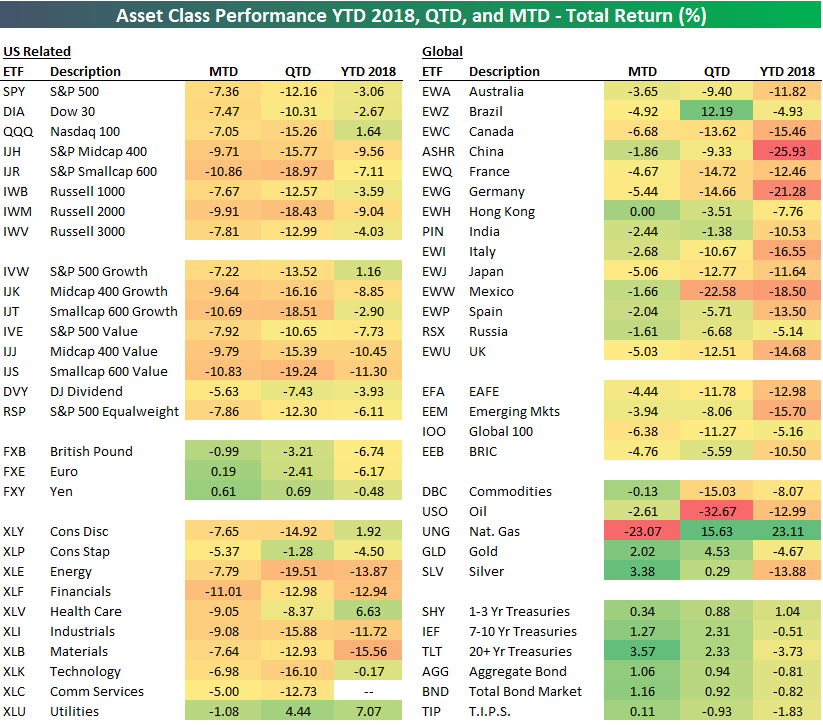
After another 2%+ decline for US equity markets yesterday, the total return picture across the equity asset space is getting uglier and uglier. Below is a snapshot of our key ETF matrix that highlights total returns across asset classes on a month-to-date, quarter-to-date, and year-to-date basis.
Month-to-date, every major US index ETF is down more than 7%, with small-caps down 10%. Quarter-to-date, the S&P 500 (SPY) is down 12%, while it’s down 3% year-to-date. The small-cap Russell 2,000 (IWM) is down a whopping 18.4% quarter-to-date, and it’s down 9% year-to-date.
Looking at US sectors, Financials (XLF) is down 11% already in December alone, leaving the sector down 13% both quarter-to-date and year-to-date. Every other sector except Utilities (XLU) is down 5% or more in December. While international equity markets are underperforming US equities quite dramatically on a year-to-date basis, you’ll notice that many areas of the world are handily outperforming the US in December. The emerging markets ETF (EEM) is down about half the amount that SPY is down month-to-date.
Commodities — outside of natural gas — have been holding up better than equities in December as well. The broad commodities ETF (DBC) is down just 13 bps this month, while gold (GLD) and silver (SLV) are both in the green. Treasuries have also caught a bid as equities have gotten pummeled. The 20+ year Treasury ETF (TLT) is up 3.57% already in December, and it’s up 2.33% quarter-to-date.
For more in-depth market analysis, try out one of our three premium research offerings.
Morning Lineup – They Can’t Go Down Every Day… Can They?
US stocks are looking to start the day higher in what bulls are hoping is a turnaround Tuesday. After two straight daily declines of nearly 2%, you would expect at least some sort of bounce. After all, stocks can’t go down every day, can they? Read today’s Bespoke Morning Lineup below for major macro and stock-specific news events, updated market internals, and detailed analysis and commentary:
Bespoke Morning Lineup – 12/18/18
Heading into today, the S&P 500 is now down 7.8% for the month of December. If the month were to end today, it would go down as the worst month for the S&P 500 since May 2010, so clearly, these kinds of declines are not typical of bull markets. Furthermore, for the month of December declines of this magnitude are practically unheard of. The last time the S&P 500 had a weaker MTD December performance through the close on 12/17 was in 1931!

Start a two-week free trial to Bespoke Premium to see today’s full Morning Lineup report. You’ll receive it in your inbox each morning an hour before the open to get your trading day started.

Trend Analyzer – 12/18/18 – Nasdaq Hanging On
Yesterday marked yet another day of steep losses across the major indices. Each of the ETFs that track the major US indices in our Trend Analyzer have now moved both deep into oversold territory as well as into downtrends. They are also all substantially below their respective 50-DMAs with the Core S&P Small-Cap (IJR) and the Micro-Cap (IWM) trading over 10% below. Year to date performance is no better with substantial losses across the board; some of which have hit double-digits. Just about the only positive to draw is the Nasdaq (QQQ). It is an island of green in a sea of red as it is the only ETF that is positive YTD. Granted, it is only up 1.64% which could be easily be erased with another session like yesterday.

50-DMA Breadth Measure Barely Hangs On
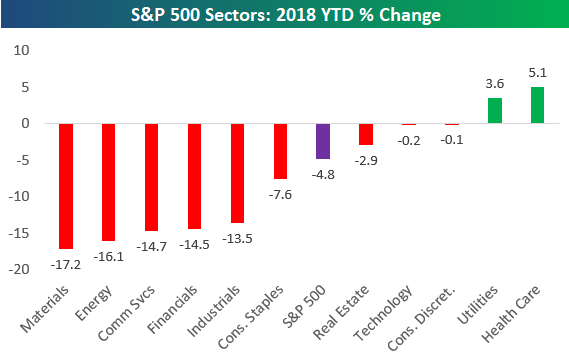
The S&P 500 has moved well into negative territory on the year now with a decline of 4.8%. As shown below, Technology and Consumer Discretionary — two sectors that were up double-digit percentage points YTD just a couple months ago — have now crossed into negative territory on the year as well. The only two sectors still in the green on the year are Health Care and Utilities, while five sectors are down double-digit percentage points. Materials are down the most with a huge drop of 17.2%, followed by Energy at -16.1%. Communication Services, Financials, and Industrials are the other three sectors down 13%+. For more in-depth market analysis, try out one of our three premium research offerings.
Below is a chart showing the percentage of stocks in the S&P 500 trading above their 50-day moving averages (DMA). While the S&P closed at a new 52-week low yesterday, this breadth reading hasn’t quite broken below the lows it saw back in October. For now, breadth using this measure has a slight positive divergence.
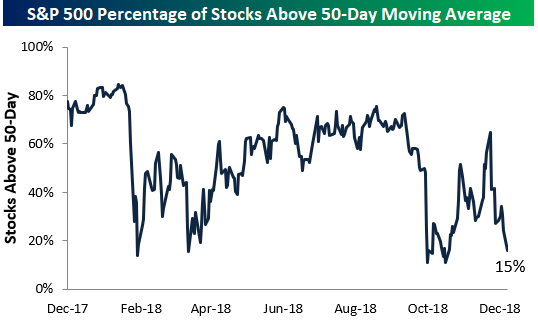
Looking at S&P 500 sectors, it’s not a pretty picture for cyclicals. Five sectors have less than 10% of their stocks above their 50-day moving averages, with Energy’s reading at 0%. The Industrials sector ranks second worst with just 3% of stocks above their 50-DMAs, followed by Materials at 4%. Technology’s reading of 14% is just a bit weaker than the reading of 15% for the broad S&P 500.
Utilities is the only sector with a strong reading at the moment with 69% of stocks above their 50-DMAs. The second best sector — Real Estate — has just 41% of its stocks above their 50-DMAs.
