2019 Outlook — International Markets
Our 2019 Bespoke Report market outlook is the most important piece of research that Bespoke publishes each year. We’ve been publishing our annual outlook piece since the formation of Bespoke in 2007, and it gets better and better each year! In this year’s edition, we’ll be covering every important topic you can think of dealing with financial markets as we enter 2019.
The 2019 Bespoke Report contains sections like Washington and Markets, Economic Cycles, Market Cycles, The Fed, Sector Technicals and Weightings, Stock Market Sentiment, Stock Market Seasonality, Housing, Commodities, and more. We’ll also be publishing a list of our favorite stocks and asset classes for 2019 and beyond.
We’ll be releasing individual sections of the report to subscribers until the full publication is completed by year-end. Today we have published the “International Markets” section of the 2019 Bespoke Report, which compares equity markets, interest rates, and economic indicators across the globe.
To view this section immediately and all other sections, sign up for our 2019 Annual Outlook Special!
Small Revisions To GDP Slow, Pretax Profits Pick Up
This morning the BEA released its final regularly scheduled revision to Q3 GDP. Overall, growth was revised down by 15 bps to 3.35% QoQ SAAR. That’s a slower growth rate than the 4.15% QoQ SAAR in Q2 but hardly a weak pace. The consumer continues to spend at a solid pace, government spending is lifting growth, and while fixed investment slowed it’s still performing reasonably well. On the other hand, housing continues to weigh on growth, and much of the sequential gain this quarter was driven by rapid inventory expansion. Typically, surging inventories would be a very negative sign, but there are two factors moderating the signal in their rapid rise in Q3. First, they’re largely offsetting crashing exports, with both inventory builds and exports likely to mean revert in Q4, at least at the margin. Second, inventory levels are very, very low relative to robust final demand, so several quarters of strong growth in inventories would be justified by final demand.
We should also note that corporate profits are growing at a steady pace. After-tax profits are somewhat distorted by huge corporate tax cuts at the end of last year, but pre-tax profits rose 3.5% QoQ (+10.4% YoY). That’s the fastest sequential growth rate since Q2 of 2014 and second-fastest since 2011.
Morning Lineup – It’s Almost Over
The week that is. As for the market decline, it’s another story as to when that will end, but no matter how you slice it, stocks are trading at extremely oversold levels similar to short-term declines we saw in early 2016, August 2015, August 2011, and before that 2008. Today, equity futures are slightly higher, but is anyone going to put any trust in them at this point? We just had a big release of economic data and for the most part, the reports came in roughly in line to below expectations, but nothing was that far off the mark. Read today’s Bespoke Morning Lineup below for major macro and stock-specific news events, updated market internals, and detailed analysis and commentary:
Bespoke Morning Lineup – 12/21/18
We have two quick charts to highlight this morning. The first is the rolling 5-day change in the S&P 500 over the last ten years. As of yesterday’s close, the S&P 500 was down 6.9% over the prior five trading days. How does that stack up to the past? You may be surprised to see that back in February we actually had a sharper drop over five days. Overall, there have only been six other periods in the last ten years where the S&P 500 fell this much or more over such a short period. What’s unique about the most recent period relative to earlier this year is that the period of selling was much quicker back then. The current period has seen a lot more consistency in terms of selling, similar to 2011.

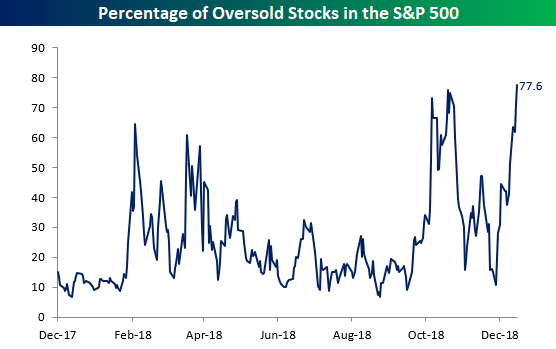
The next chart shows the percentage of oversold stocks in the S&P 500 (trading more than one standard deviation below their 50-day moving average). The current level of 77.6% is now the highest level in well over a year. In fact, you have to go back to January of 2016 to find a higher reading.
Start a two-week free trial to Bespoke Premium to see today’s full Morning Lineup report. You’ll receive it in your inbox each morning an hour before the open to get your trading day started.

2019 Outlook — The Year In Headlines
Our 2019 Bespoke Report market outlook is the most important piece of research that Bespoke publishes each year. We’ve been publishing our annual outlook piece since the formation of Bespoke in 2007, and it gets better and better each year! In this year’s edition, we’ll be covering every important topic you can think of dealing with financial markets as we enter 2019.
The 2019 Bespoke Report contains sections like Washington and Markets, Economic Cycles, Market Cycles, The Fed, Sector Technicals and Weightings, Stock Market Sentiment, Stock Market Seasonality, Housing, Commodities, and more. We’ll also be publishing a list of our favorite stocks and asset classes for 2019 and beyond.
We’ll be releasing individual sections of the report to subscribers until the full publication is completed by year-end. Today we have published the “Year In Headlines” section of the 2019 Bespoke Report, which recaps the market year with a sampling of headlines from Bloomberg and the Wall Street Journal.
To view this section immediately and all other sections as they’re published between now and December 21st, sign up for our 2019 Annual Outlook Special!
Bespoke CNBC Appearance (12/20)
Bespoke co-founder Paul Hickey appeared on CNBC’s Squawk Box on Thursday morning to discuss the markets and their reaction to Wednesday’s FOMC meeting. To view the segment, click on the image below.

2019 Outlook — Analyst Ratings
Our 2019 Bespoke Report market outlook is the most important piece of research that Bespoke publishes each year. We’ve been publishing our annual outlook piece since the formation of Bespoke in 2007, and it gets better and better each year! In this year’s edition, we’ll be covering every important topic you can think of dealing with financial markets as we enter 2019.
The 2019 Bespoke Report contains sections like Washington and Markets, Economic Cycles, Market Cycles, The Fed, Sector Technicals and Weightings, Stock Market Sentiment, Stock Market Seasonality, Housing, Commodities, and more. We’ll also be publishing a list of our favorite stocks and asset classes for 2019 and beyond.
We’ll be releasing individual sections of the report to subscribers until the full publication is completed by year-end. Today we have published the “Analyst Ratings” section of the 2019 Bespoke Report, which looks at the percentage of buy, sell, and hold ratings from Wall Street analysts and how they have changed over the last year. We also provide lists of the most and least loved stocks by analysts, and which stocks analysts have gotten the most bullish or bearish on this year.
To view this section immediately and all other sections as they’re published between now and December 21st, sign up for our 2019 Annual Outlook Special!
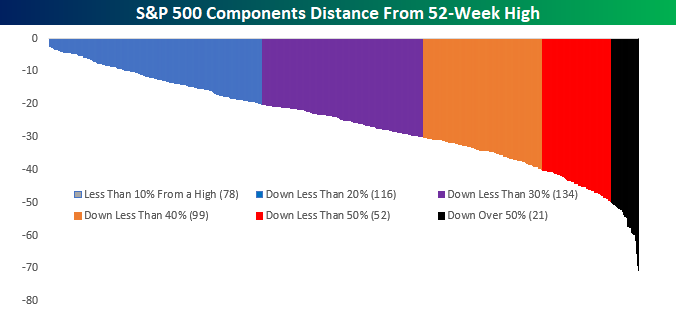
Average S&P 500 Stock Decline Exceeds 25%
The S&P 500 may not have reached bear market territory as an index yet, but of the 500 individual stocks in the index, more than 60% are down at least 20% from their 52-week highs. Overall, the average decline from a 52-week high is a staggering 25.7%! The chart below shows the distance each of the individual components is trading from their 52-week highs grouped by 10 percentage point ranges. As of Thursday afternoon, just 72 stocks in the S&P 500 are even trading within 10% of their 52-week highs. Meanwhile, 82 stocks in the index are down 40% or more with 24 of those 82 stocks down by more than half! Have their been uglier periods for the stock market? You bet. But not in a long time.
So which stocks are down the most? There are actually a number of well-known names with stocks like General Electric (GE), Western Digital (WDC), Nvidia (NVDA), Halliburton (HAL), Wynn Resorts (WYNN), Micron (MU), and Applied Materials (AMAT) all having been more than cut in half.
Bespoke’s Sector Snapshot — 12/20/18
Chart of the Day: CDS Checkup
Bulls Come Back…For Now
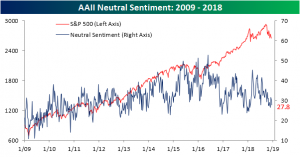
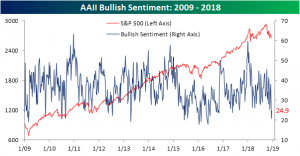
The survey of individual investor sentiment from AAII showed slightly more optimism this week with bullish sentiment coming in at just under 25%. That is a 4% jump from last week’s plunge to 20.9% taking equally from the bearish and neutral camp. Even with this increase, the results are not overly optimistic as bullish sentiment is still the minority opinion and at much lower than average levels. Last week’s reading was historically low, so it isn’t surprising that there was a small bounce. This week’s reading is also a divergence from price action in that time. On top of yesterday’s steep declines, markets have been broadly down since the last report alongside it being one of the worst Decembers to date, so an uptick—even a small one—is a bit of a surprise. If the current pace of market weakness continues, don’t expect the sentiment boost to last very long.
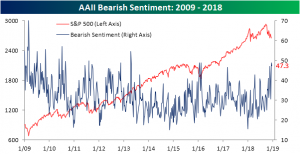
Additionally, yesterday’s declines in the wake of the FOMC meeting are also likely to drain optimism. A near majority of investors are still pessimistic on the market as bearish sentiment remains at extremely elevated levels. Ignoring the prior week, this week’s reading of 47.3% bearish sentiment is still right at multi-year highs. In addition, and we have been seeing this a lot of late, since the AAII survey closes on Wednesday nights, the full impact of Wednesday’s declines—especially late in the day like yesterday—can be reasoned to not fully come into play for the sample of surveyed investors. In other words, the damage done from Fed Chair Powell’s words likely weighed very lightly on this survey. Moving to next week, as scary of a thought as it may be, we could see yet another large rise in bearish sentiment to even more elevated levels if price action is similar to how it has been.
Meanwhile, neutral sentiment came in a few points lower at 27.8% from last week’s 30.23%. Neutral sentiment still outweighs bullish sentiment which expresses a decent degree of uncertainty among individual investors.