S&P 500 Stocks Distance From 52-Week Highs: Now vs Christmas Eve
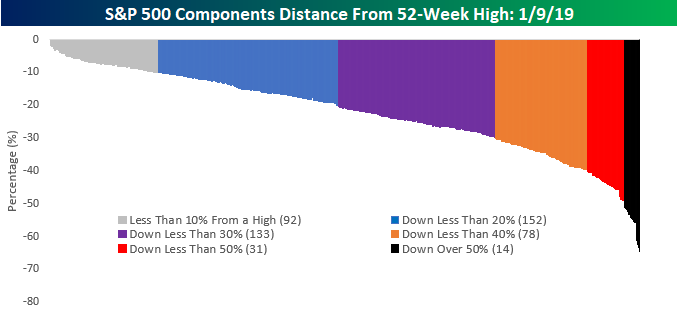
The S&P 500 is currently trading up just over 10% from its closing low on Christmas Eve, so we wanted to take a quick moment to show how dramatically things have changed with respect to how individual stocks are trading relative to their 52-week highs. For the individual stocks in the S&P 500, the are down an average of 22.2% from their 52-week highs. That’s a pretty dramatic shift from Christmas Eve when they were down an average of 29.2%!
The chart below shows how far down each individual component is from its 52-week high as of this afternoon. As shown, nearly half of the stocks in the S&P 500 are trading within 20% of a 52-week high (92 down less than 10% and 152 down less than 20%). At the other end of the spectrum, there are now just 31 stocks trading down between 40% and 50% from their 52-week high while just 14 are down by over half.
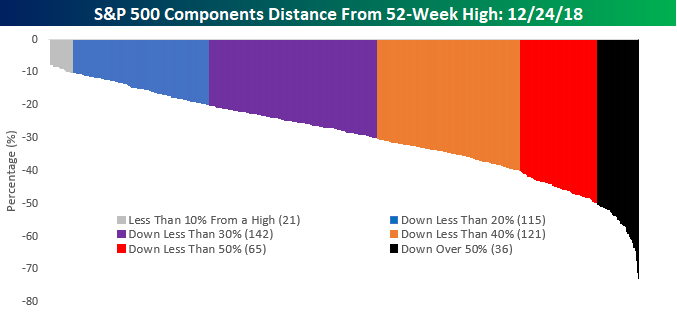
The picture today stands in stark contrast to the one we saw just ten trading days ago. The chart below shows where individual stocks were trading relative to their 52-week highs as of the close on 12/24. Here, you’ll notice that the width of the bands to the left of the chart are a lot narrower than the ones above, but then as you move out to the right they widen. For example, whereas there are currently 92 stocks within 10% of a 52-week high, back on the 12/24 there were only 21! Conversely, on 12/24 there were 36 stocks in the S&P 500 down over 50% from their 52-week highs, but today there are less than half that at just 14! What a difference ten trading days can make!
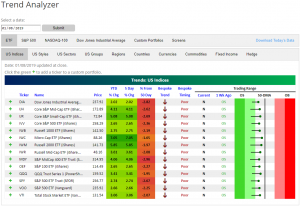
Trend Analyzer – 1/9/19 – The Picture One Week In
We are now one full trading week into 2019 and things have definitely picked up from where we had left off in 2018. Each of the major index ETFs are finally in the green on a YTD basis. In addition, after starting off the year at extremely oversold levels from the Christmas Eve bottom, the recent rally has lifted all of these ETFs out of oversold and firmly into neutral territory. Each one is also within 3% of their respective 50-DMAs which going forward could potentially be a key point of resistance from a technical perspective.
The heavily battered small caps in 2018 have taken a 180-degree turn this year as well. They caught a bid in the new year and are the biggest gainers of the major indices thus far. Conversely, large-cap focused ETFs have been relative laggards. This new year rotation has led the Microcap ETF (IWC) to rocket ahead of its peers with gains more than double the S&P 500 (SPY) and triple the Dow (DIA). DIA, while still positive, has been the worst performer with a gain of just over 2%.
Bespoke’s Global Macro Dashboard — 1/9/19
Bespoke’s Global Macro Dashboard is a high-level summary of 22 major economies from around the world. For each country, we provide charts of local equity market prices, relative performance versus global equities, price to earnings ratios, dividend yields, economic growth, unemployment, retail sales and industrial production growth, inflation, money supply, spot FX performance versus the dollar, policy rate, and ten year local government bond yield interest rates. The report is intended as a tool for both reference and idea generation. It’s clients’ first stop for basic background info on how a given economy is performing, and what issues are driving the narrative for that economy. The dashboard helps you get up to speed on and keep track of the basics for the most important economies around the world, informing starting points for further research and risk management. It’s published weekly every Wednesday at the Bespoke Institutional membership level.
You can access our Global Macro Dashboard by starting a 14-day free trial to Bespoke Institutional now!

Morning Lineup – Rally Rolls On
After trailing off a little bit earlier, US equity futures are drifting back towards their highs of the morning. These gains come despite the fact that the World Bank lowered its 2019 global growth forecasts and Apple is reportedly cutting iPhone production by another 10%. Rallies on bad news are certainly a change in tone from what we became accustomed to in the fourth quarter of 2018. Read today’s Bespoke Morning Lineup below for major macro and stock-specific news events, updated market internals, and commentary.
Bespoke Morning Lineup – 1/9/19

Start a two-week free trial to Bespoke Premium to see today’s full Morning Lineup report. You’ll receive it in your inbox each morning an hour before the open to get your trading day started.

Best and Worst Performing Stocks Since Christmas Eve
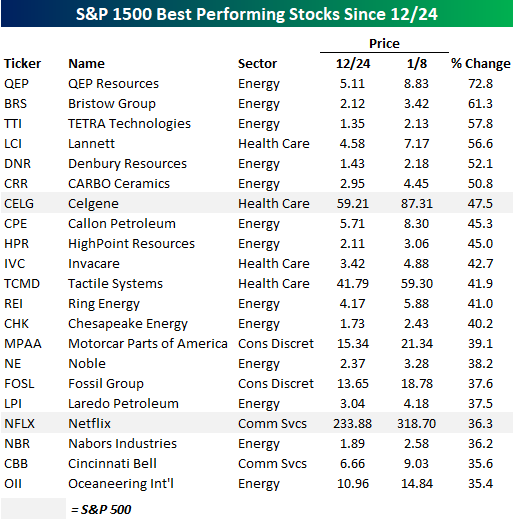
The “Christmas Eve Stock Market Massacre” was just a little over two weeks ago, but in the time since then equities have come roaring back. In the S&P 1500, which encompasses large, mid, and small cap stocks, the average performance of individual stocks since the close on 12/24 is a gain of 11.4%, while the average S&P 500 stock is up a bit less at 9.5%. Amazingly, just 29 stocks in the entire S&P 1500 are down relative to their closing prices on 12/24, and just eleven of those are in the S&P 500.
With respect to the entire S&P 1500, there are 21 stocks that have rallied more than 35% since 12/24, and as shown in the table below, 13 of them are from the Energy sector, including four of the top five. The only two stocks in the S&P 500 that made the list of biggest winners were Celgene (CELG), which is being acquired, and Netflix (NFLX), which is up over 36%.
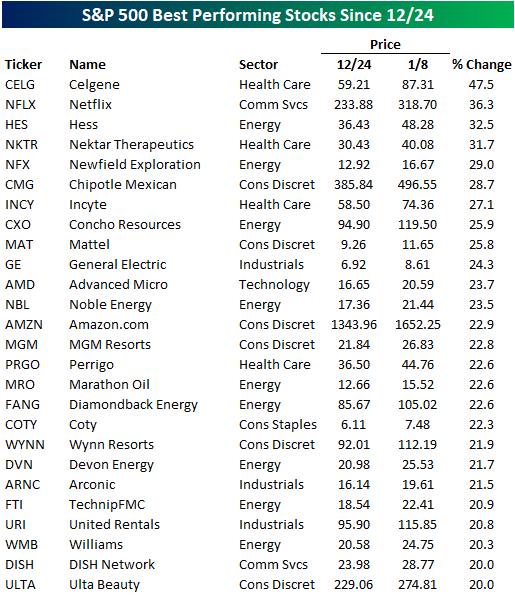
Speaking of the S&P 500, the table below lists the 26 stocks in the index that have rallied 20%+ since the close on 12/24. Unlike the list of best performing S&P 1500 stocks, stocks from the Energy sector are not as dominant on the list, though there are still nine names from that sector. In addition to fewer names from the Energy sector, more of the stocks are more recognizable including Chipotle (CMG), Mattel (MAT), General Electric (GE), Amazon.com (AMZN), and Ulta Beauty (ULTA).
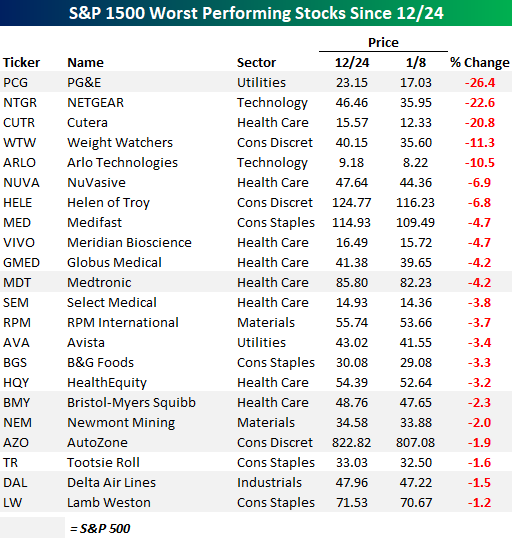
As mentioned above, there aren’t a whole lot of stocks that have traded lower relative to their closing levels on 12/24. In fact, just 22 stocks have declined more than 1% during that span, and we highlight them in the table below. Leading the way lower is PG&E (PCG), which is facing a potential bankruptcy filing due to exposure from the California wildfires. As a result, the stock is down over 25% since 12/24. Behind PCG, the only two other stocks that are down more than 20% are NETGEAR (NTGR) and Cutera (CUTR).
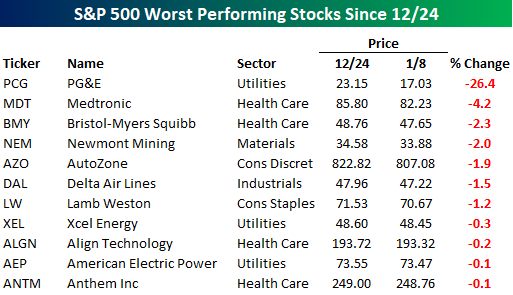
Finally, narrowing our focus to just the S&P 500, the table below lists the eleven S&P 500 stocks that are down since 12/24. Of the stocks listed, just seven stocks made the list as losers have been hard to come by. What a shift from just two weeks ago when winners were few and far between!
JOLTS Data Slows, But Not In Education
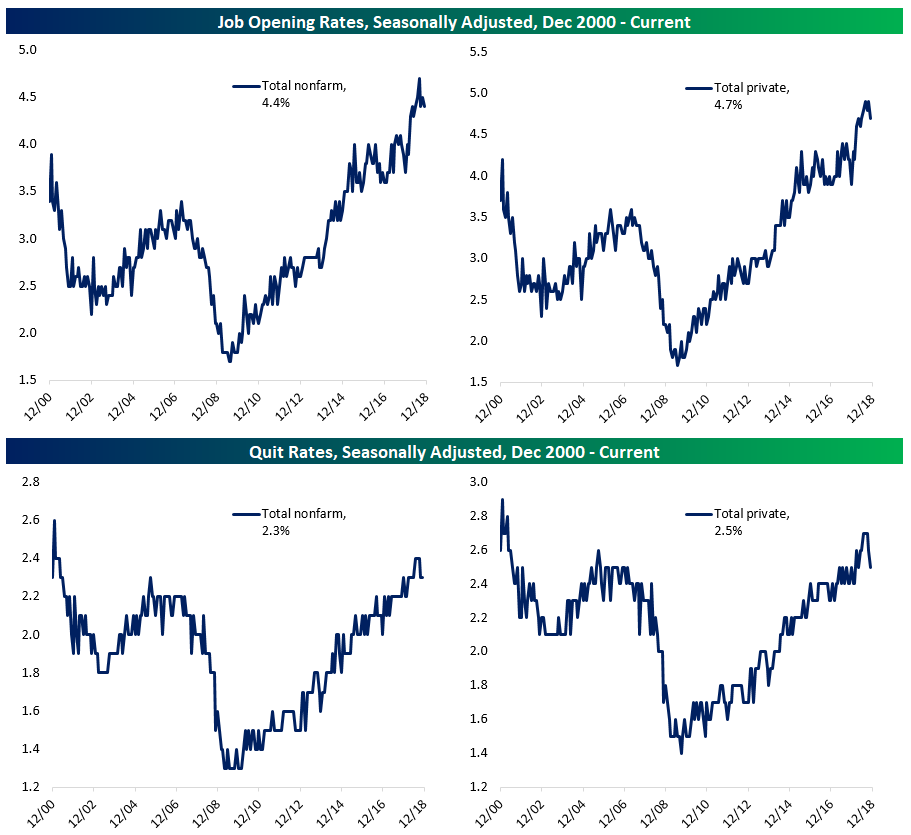
Today the BLS, which isn’t part of the general US data blackout related to the government shutdown due to still-in-place appropriations, released the Job Openings and Labor Turnover Survey (JOLTS) data for the month of November. As shown in the charts below, openings rates (which measure the number of open positions at employers relative to the labor force and are an indication of labor demand) have come in a bit over the last few months after hitting record highs dating back to 2000 in the middle of last year. We should note that these rates are quite volatile and subject to significant revision, so a modest decline isn’t the end of the world. Quit rates, which are an indicator of labor confidence and bargaining power (measuring the number of quits relative to the labor force) have also pulled back a bit from the highest levels since the end of the 1990s expansion.
One area where neither quits nor openings have shown any softness is for public school teachers. The openings rate is the joint-highest (with three other occurrences) since data collection began, and quits are also at the joint-highest levels of the entire series. Pensions, stability, and tenure-related incentives are key reasons that job openings and quits for teachers are typically lower than the population as a whole, but this pocket of the labor market is facing much tighter conditions than has historically been the case. Low pay, benefit cuts, and other issues which have resulted in a number of national teachers’ strikes are all possible causes of the historically tight conditions in the educator labor market.
Bespoke Stock Scores — 1/8/19
B.I.G. Tips – Spread Compression
Chart of the Day: URI Would Benefit From A Bounce In Cyclicals
Trend Analyzer – 1/8/19 – Bye Bye Oversold
Another day of gains yesterday has helped to push every major index ETF out of oversold and into neutral territory; something we haven’t seen since the end of November. These index ETFs tracked in our Trend Analyzer have been predominantly oversold since early December and even reached very extreme levels at some points. While they may not be oversold, they have yet to break out of their downtrends and none have taken out their 50-DMA. Also of note is the divergence between the performance of large cap versus small cap ETFs. Of these names, small caps continue to lead the way as the Micro-Cap ETF (IWC) is up 6.48% in the last week and 5.58% since the start of the year. That is a major degree of outperformance when compared to the Dow (DIA) which is only up 2.12% in the past 5 days and 0.93% on the year.
