Dec 28, 2022
Earlier today we published our Global Macro Dashboard which provides an overview of the main economic and market data of 22 major global economies. In the table below, we show the recent performance of the ETFs tracking those same countries.
With 2022 drawing to a close, there are only two countries that are currently in the green for the year: Brazil (EWZ) and Mexico (EWW). Neither are up much, but up is up, especially in a year like this one.
In terms of month-to-date change, Hong Kong (EWH) has risen the most with a 5.62% gain, while China (MCHI) is up a modest 0.46%. On the other end of the spectrum, Taiwan (EWT) has fallen sharply with an over 20% decline, but most of that drop is actually due to a $5.18/share long-term capital gain that the fund paid out earlier this month. Click here to learn more about Bespoke’s premium stock market research service.

Dec 28, 2022
Our Matrix of Economic Indicators provides a concise summary analysis of the US economy’s momentum. We combine trends across the dozens and dozens of economic indicators in various categories like manufacturing, employment, housing, the consumer, and inflation to provide a directional overview of the economy.
To access our newest Matrix of Economic Indicators, start a two-week free trial to either Bespoke Premium or Bespoke Institutional now!

Dec 28, 2022
Yesterday Amazon (AMZN) became the third of the mega-cap FAANG+ stocks (along with META and NFLX) to close below its closing low made during the COVID Crash in March 2020. Not only have all of AMZN’s post-pandemic gains been erased, but it’s now trading below its lowest close made during the COVID Crash!

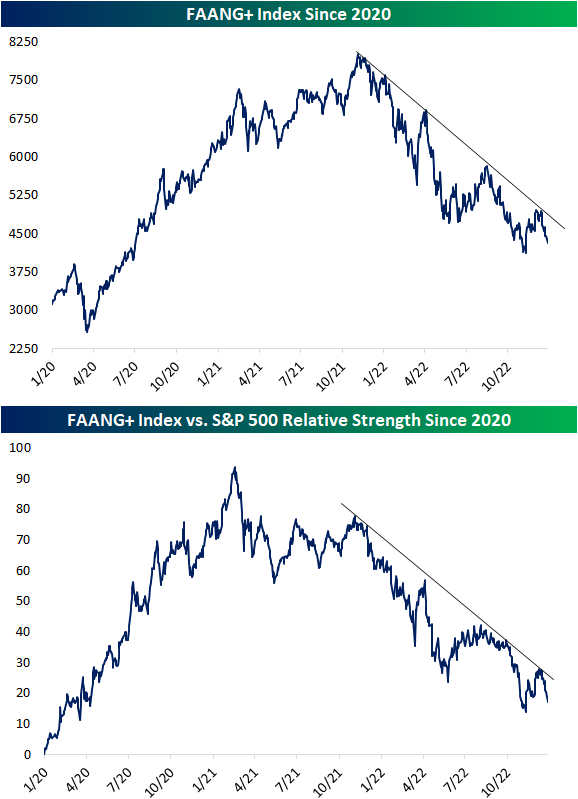
NYSE’s FAANG+ index is described as an index of “10 of today’s highly-traded tech giants.” Given that most of the FAANG+ stocks account for a massive portion of the market cap weighted S&P 500, they are an impactful group. As shown below, the FAANG+ index peaked in early November last year and has dropped 46% since then. The drop more recently follows a failed breakout above the top of its downtrend channel as the index is now back to within 5% of this past November’s low. On a relative basis, the group has been underperforming the broader market for even longer with a high in February of last year.
Below is a look at the ten FAANG+ stocks. As shown, they came into the year with a combined market cap of $12.3 trillion, and they’re ending the year with a combined market cap of just over $7 trillion. While Apple (AAPL) has fallen the least YTD in terms of share price change, it has lost the most in market cap at $844 billion. Amazon (AMZN) has seen its market cap fall the second-most at $843 billion, essentially getting cut in half. Tesla (TSLA), along with AMZN, is one of two names that lost their “$1 trillion market cap” club status this year. TSLA is now down 69% on the year, and its market cap has fallen from $1.06 trillion down to just $344 billion. The other FAANG+ stocks that are down 50%+ on the year include Meta (META), NVIDIA (NVDA), Netflix (NFLX), AMD, and Snowflake (SNOW).
With markets continuing to drop in these final trading days of December, on an absolute basis, 2022 is going to go down as the biggest year of wealth destruction ever for the US equity market. In 2008, the Russell 3,000 saw its market cap fall by $6.7 trillion. As of today, the Russell 3,000’s market cap has fallen about $11.2 trillion so far in 2022. $5.2 trillion of that $11.2 trillion decline has come from just the ten FAANG+ stocks shown below. Click here to learn more about Bespoke’s premium stock market research service.

Dec 28, 2022
Searching for ways to better understand the fixed income space or looking for actionable ideas in this asset class? Bespoke’s Fixed Income Weekly provides an update on rates and credit every Wednesday. We start off with a fresh piece of analysis driven by what’s in the headlines or driving the market in a given week. We then provide charts of how US Treasury futures and rates are trading, before moving on to a summary of recent fixed income ETF performance, short-term interest rates including money market funds, and a trade idea. We summarize changes and recent developments for a variety of yield curves (UST, bund, Eurodollar, US breakeven inflation and Bespoke’s Global Yield Curve) before finishing with a review of recent UST yield curve changes, spread changes for major credit products and international bonds, and 1 year return profiles for a cross section of the fixed income world.
In this week’s report, we review fixed income returns this year.

Our Fixed Income Weekly helps investors stay on top of fixed-income markets and gain new perspectives on the developments in interest rates. You can sign up for a Bespoke research trial below to see this week’s report and everything else Bespoke publishes free for the next two weeks!
Click here and start a 14-day free trial to Bespoke Institutional to see our newest Fixed Income Weekly now!